
RMA Feature Focus: Forecasting Module

Jennifer Sowinski Nemeth
Senior Consultant & Analyst
It’s that time of year again. With seasons being announced and renewal mailings being sent, it’s time to create some new forecasts!
For a full refresher on how to use the forecasting module in the RMA, check out the RMA help site here. If you’re looking for some tips to help your forecasting go smoothly this year, read on!
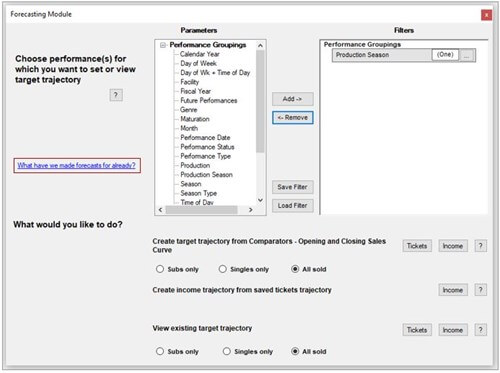
Tip 1 – What have we made forecasts for already?
As you’re creating your trajectories, you probably (hopefully), go in a specific order, so that you can keep track of which performances you have or have not made forecasts for. But, how often do you get distracted by a coworker or an email and lose track of where you are? Don’t worry – there’s a report for that!
If you need to check which performances you’ve already made forecasts for, just click the blue link, and set your filters to the performances in question:
This will open up a table report, with a row for each performance in your filters. A “Y” in a column indicates that you have already created that type of trajectory for that performance, and a “C” indicates that a combination trajectory has been created for you.
Tip 2 – Save your filters ahead of time
Make your time in the forecasting module simpler by saving your comparator filters before your start. Use a sales curve to view your comparators, remove any outliers or “fake” performances, and make sure you’re happy with the comparators you’ve chosen. Then, save all of the filters that you plan to use for forecasting – one for each day of week/time of day/week of run, depending on how granular your trajectories will be. Then, when it comes time to choose your comparators in the forecasting module, all you need to do is load a filter!
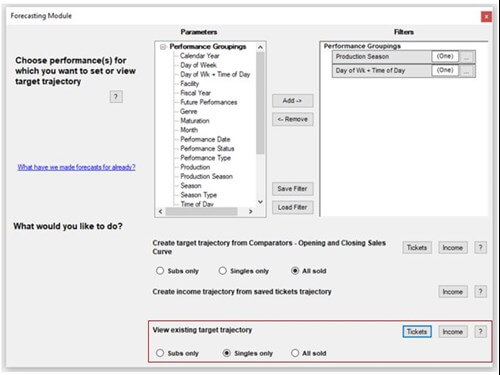
Tip 3 – View existing target trajectory
While you’re in the process of creating your trajectory, you’re probably already aware that you have the option to edit your curve. But, did you know that you can view and edit your curve whenever you want, even months after you created it? To do so, set your filters for the performances you’d like to view, then use the “View existing target trajectory” option to select your curve.
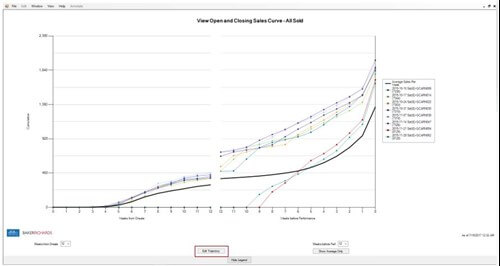
This will open up a curve that displays each performance you’ve selected in the filters, as well as a bold black line representing the corresponding trajectory. (If you’ve chosen multiple performances with different trajectories in your filters, the wizard will ask you to select only one before you’re able to view it.)
As you’re viewing your curve, if you’d like to edit the trajectory, just hit the button at the bottom of the window, and make your adjustments. Changes that you save here will also affect the targets on your dashboards and throughout the RMA.
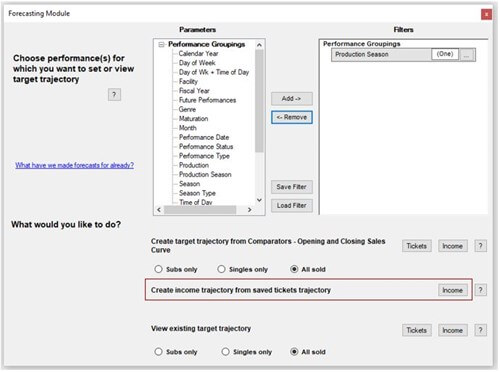
Tip 4 – Create income trajectory from saved tickets trajectory
If you’ve edited your tickets trajectory, you might want to create an income trajectory that matches the shape of this new curve, rather than your original comparators. To do so, use the “Create income trajectory from saved tickets trajectory” option. Since you’re not using comparators for this forecast, you’ll need to manually enter an average ticket price, which you can find in a configurable table report. For complete details on how to create this kind of income curve, watch the second video on this RMA help page.
We hope these tips make your forecasting a breeze!