
Segmentation Engine Feature Focus: Tracking Audience Behavior Post-COVID

Jamie Alexander
Director, JCA Arts Marketing
It may be hard to imagine right now, but there will be a day when performing arts organizations get to reopen their doors and start performances again. When that day comes, the audience will be different. Economic, social, and health pressures will change how we all decide to consume the performing arts, and arts administrators will need to adjust communication, marketing, and development plans around those changes.
The Segmentation Engine will help you define your audience’s changed behavior post-COVID, so you can adjust your marketing and development plans accordingly. But first (and many of you have already done this), you have to examine how your audience behaved pre-COVID, so that you have a benchmark against which to mark the change. Then you can be deliberate about the adjustments you make to your communication post-COVID. Note: if you don’t have time to capture these metrics now, you can also adjust your settings later to look at the time period before COVID.
Here are some behavior metrics that you should be using to measure the change in audience behavior post COVID, as well as the Segmentation Engine reports that will give you the data:
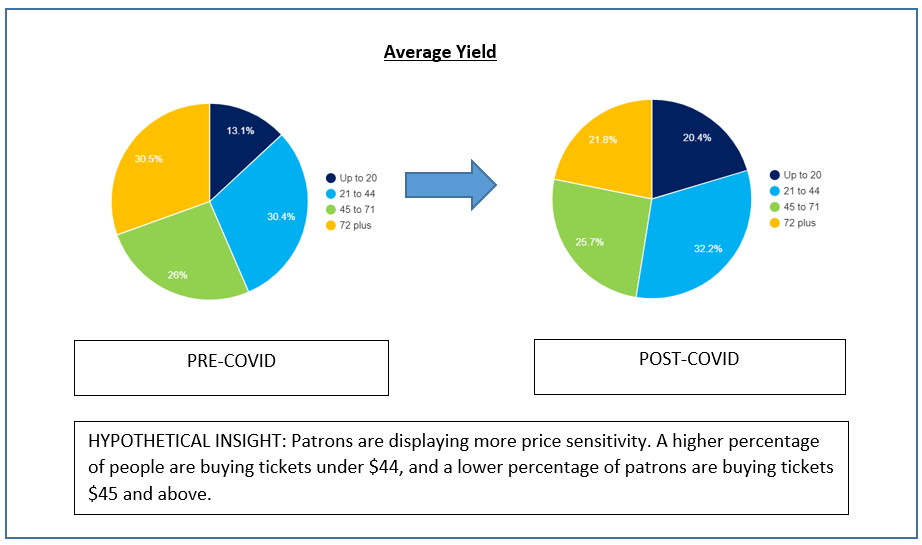
PRICE PREFERENCE
After COVID, some patrons will be more price sensitive, while some may be willing to pay the same (or more) on tickets as they did before. This can, and should, influence on your pricing strategy.
Use Average Yield in the Behavioral Variables Dashboard to find how price preference fluctuates. Here’s an example of what you might find:
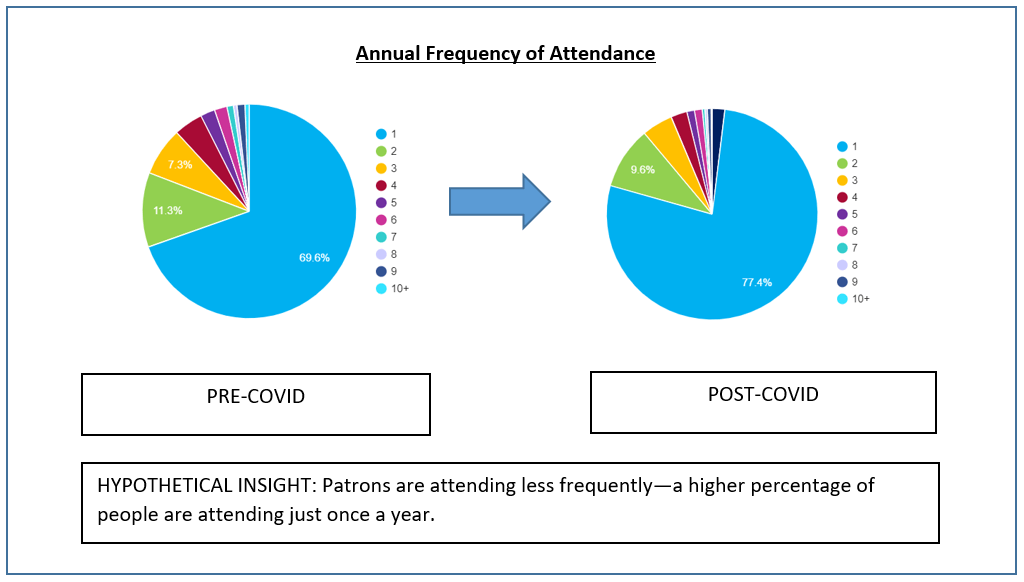
FREQUENCY OF ATTENDANCE
It could be that, after COVID, audiences are more reluctant to attend frequently due to health or financial concerns. Alternatively, they may have missed live performances so much that they attend more often!
Use Average Annual Frequency in the Behavioral Variables Dashboard to see how frequency of attendance by year has changed. This measure is likely best used after a full season is completed following COVID. Here’s an example of what you might find:
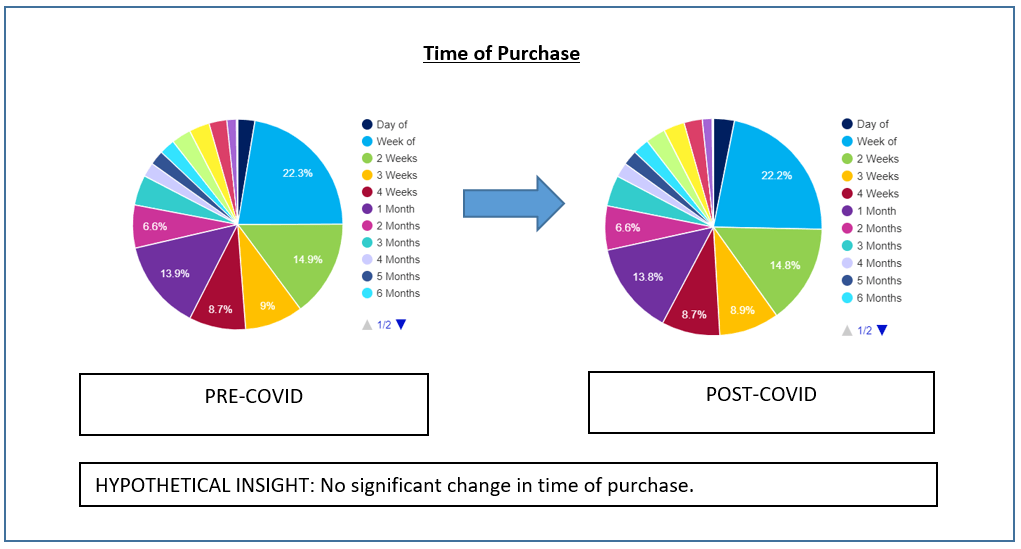
TIME OF PURCHASE
Will COVID affect when people purchase? Maybe a large portion of your patrons started booking tickets 2 weeks before a show—will they be more likely to purchase further in advance? Or will uncertainty cause them to book closer to the show?
Find out using Time of Booking in the Behavioral Variables Dashboard to see when patrons tend to buy in advance of performances.
SUBSCRIBER FLOW
The Flow Report – Annual in the Annual Segmentation dashboards will take a given season and show you patron frequency before and after that season. This way you can see how subscribers move in and out of subscribing, and where they go, from season to season.
PROGRAMMING PREFERENCE
Perhaps people’s artistic pallets will adjust post-COVID? If you already using Performance Classifications and Repertoire Scoring, you can review the respective behavior variables to look at potential changes in programming interests, such as:
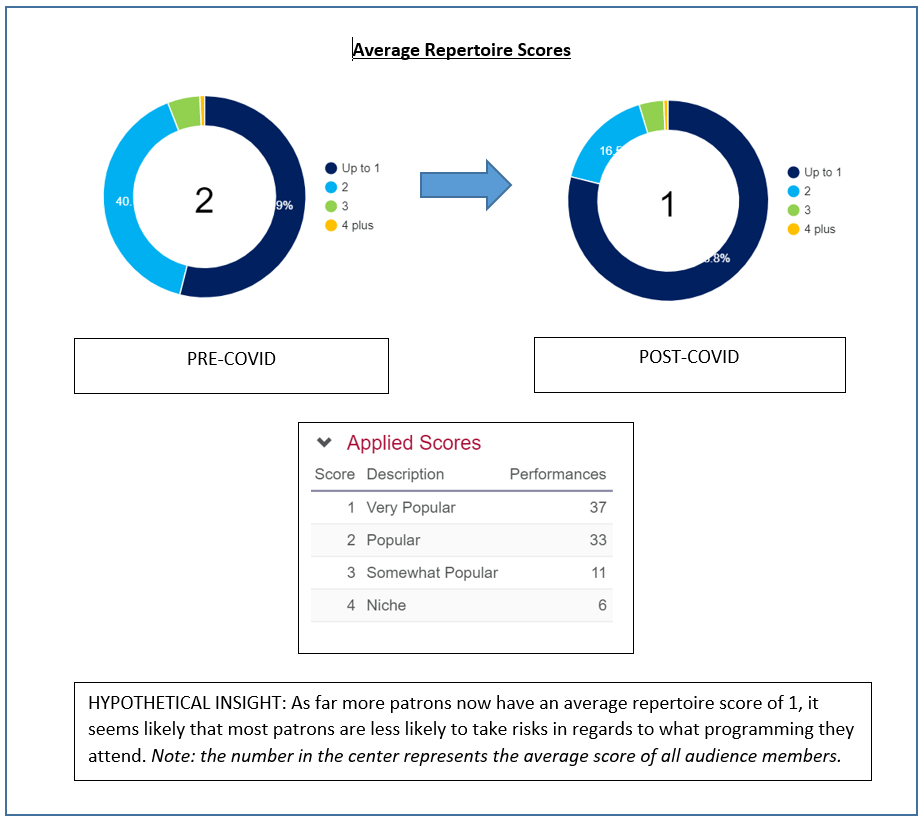
If you aren’t currently using Performance Classifications and Repertoire Scoring, you can start coding performances in the Classify Performances dashboard.
ANNUAL BEHAVIOR
To get a big picture, overall look at how patron behavior changes from year to year, look at the Annual Segmentation Report. You can flip between season to see how they relate to each other, and how the average behavior of the audience has changed.
CUSTOM SEGMENTS
If you have Custom Segments in Segmentation Engine, the first step is to track the changes within the segments post-COVID. Particularly, watch out for how patrons flow between segments. Eventually, you may want to make adjustments to the definitions of your custom segments, which we can help you with.
EXCHANGE RATE AND TIMING
As most organizations are offering more flexibility for their patrons when they reopen, it’s important to track who is exchanging their tickets and when. These aren’t measures that are currently offered in the Segmentation Engine, though if you are an RMA user you can look at the volume of refunded, exchanged, and donated tickets per performance.
If you need help pulling any of the above data, or have questions around the process, please reach out to us. We’re here to help you be successful in your marketing or development campaigns as the world starts to reopen.