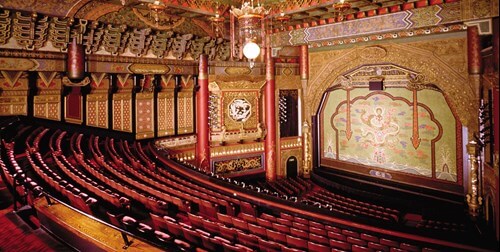
Ever since that 2015/16 season, the revenue management team at the 5th Avenue Theatre meets twice a week to review reports in the RMA and make decisions about pricing and inventory that capitalize on unsold seats. Reports the team uses include:
Sales Curve: The sales curve allows you to see the volume and timing of ticket sales for a production, compared to similar productions. The 5th Avenue theatre uses sales curves as a starting point for identifying demand for a performance and spotting opportunity for price adjustments.
Configurable Monitoring Dashboard: This comprehensive dashboard shows sales trends for each individual performance across an entire run of a production. It allows the team at 5th Avenue to monitor the amount of tickets sold and house capacities each week and spot opportunities for dynamic pricing and discounting by performance, price type, and zone.
Configurable Table Report: This is a data table that shows key metrics and allows you to easily compare those metrics to other performances, productions, and seasons. The team at 5th Avenue uses this report to measure incremental revenue and compare average price and yield from show to show and year to year. For 5th Avenue, average ticket yield can be as or more important than number of tickets sold.7
HotSeat Index: This is a heat map which lets you see how well each seat in the auditorium performs by a variety of different metrics including number of times issued, speed of sales, and total income. The 5th Avenue Theatre uses this report to gage popularity of different seats and price points.
Among many findings, here are some key insights the team learned by using the RMA:
- Weekend matinees always sell best, and Tuesday/Wednesday performances are less popular.
- Preview performances don’t need to be cheaper. The team bumped up Friday/Saturday previews for West Side Story to mirror regular weekend pricing and saw no price resistance. The 5th Avenue team has since continued this practice with other shows.
- Most discounting should be focused on the week-day preview performances.
- Small changes to pricing can add up. By spotting opportunities for dynamic pricing early, the team captures little bits of money here and there and helps the organization reach sales goals.
- The best seats in the orchestra always sell, and can be priced accordingly, though it is important to 5th Avenue that they promote accessible price types and offer third-party ticketing for more price-sensitive patrons.
- There are opportunities for rezoning and re-scaling. The team identified an opportunity to add premium pricing in Zone 1 in the orchestra, while reducing the price of Zone 1 in the mezzanine. The team has even taken what they have learned and realized that initial base prices could be higher from the start.
- Micro-zoning works. The practice of having smaller zones within larger zones, that can easily change price according to demand, is effective for the 5th Avenue Theatre.
By applying the insights gained from the RMA, the team at 5th Avenue Theatre was able to achieve the following results:
| Season |
Incremental Income |
| 2015/16 |
$405,247 |
| 2016/17 |
$947,786 |
| 2017/18 |
$633,491 |
| 2018/19 |
$1,376,170 |
| TOTAL |
$3,362,694 |
That’s a ROI on the RMA of over 6700%!
Says Chris Marcacci, Director of Marketing for the 5th Avenue Theatre:
“While the monetary ROI of RMA just from incremental income alone has been amazing, the overall effect on my team and our workload also cannot be overstated. We now spend our time actually focusing on the data, and taking what we have learned to implement changes instead of spending all of our time just getting to the data to begin with. It has improved the effectiveness of every area of our business, from inventory and revenue management to advertising planning to communications and messaging.”
Learn how the RMA can help your team increase revenue—contact us for a demo.


