How Your Ticketing Data Can Ease Your Economic Anxiety

Jonathan Carpenter
Program Manager, Performing Arts
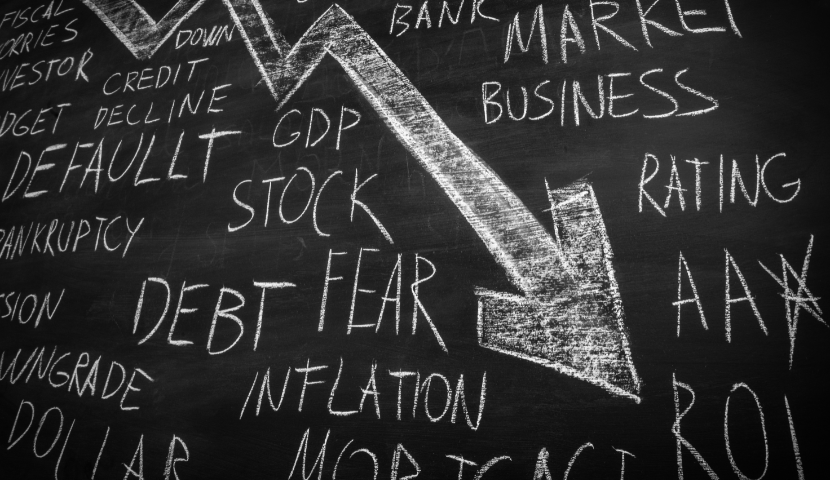
Economic uncertainty. Inflation anxiety. Fears of a recession.
2025 has seen a particularly high degree of economic anxiety, and performing arts organizations are understandably concerned about how larger economic trends will affect them. It’s natural to worry about whether audiences will continue to buy tickets at the rate they have been or if they will reduce spending on live entertainment in favor of other expenses.
The good news is that, so far, our clients are finding that their fears of the worst largely haven’t come to pass in the first half of 2025. While we can’t predict the future and guarantee that the trend of stable ticket sales will continue, you already have an incredible tool to help ease your economic anxiety: your ticket sales data.
Your ticket sales data can help you understand whether your audiences are meaningfully changing their buying patterns and their spending. It can be daunting at first to shine a strong light on your sales, but we encourage you to activate your inner data diva and dig into your data. What you find will help you to see if there’s a reason to be concerned—and we hope you’ll be pleasantly surprised by what you find.
Sales Curves
Use sales curves to look for changes in overall demand.
A sales curve charts your cumulative sales over time, allowing you to see how sales have grown over the course of a sales cycle. It can be an incredibly helpful tool to understand how your current sales compare to past sales, and where there might be changes in audience behavior and spending.
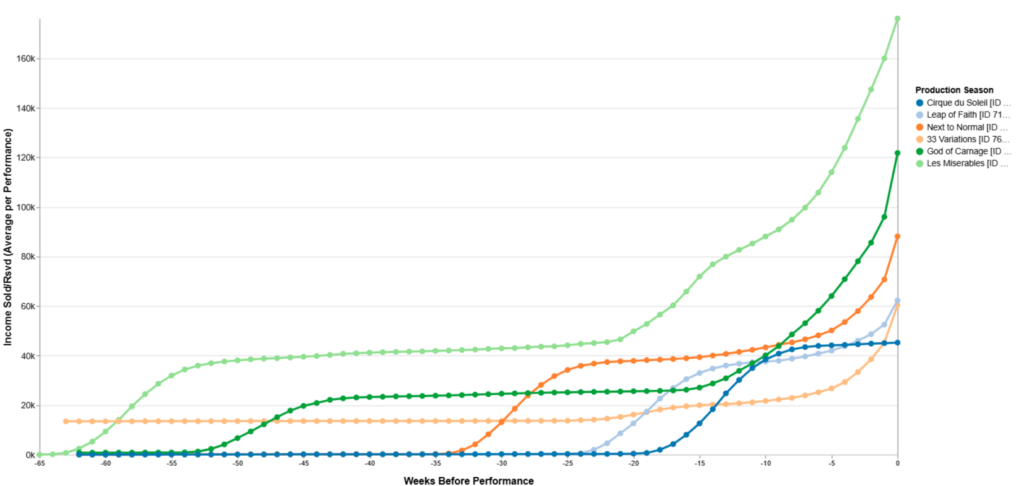
There are many ways to look at a sales curve—beyond simply charting sales for an upcoming performance. You can consider the number of tickets sold or the revenue generated. You can look at total sales for a production or season, or look at average sales on a per-performance basis.
You can adjust how you “anchor” your sales curve. Are you evaluating sales based on how they’ve progressed since your on-sale date, or are you looking at how sales have progressed based on days before the performance?
You can also look at sales by ticket type—such as subscription, standard, or single tickets.
Slicing the data in a variety of ways will help you uncover sales trends that might point to areas where there’s a change in demand or the speed at which tickets are sold, which might be an indication of economic anxiety (or confidence!). Our revenue management tool, Vivian, makes it especially easy to slice and dice the data by these various anchors and measures.
Here are a couple exercises to consider:
Overall Season Sales
Using a sales curve, look at average ticket sales per performance for the 2024-25 season relative to past seasons (we recommend going back to 2022-23). Were there any notable changes? Were they programming related, or were there peaks and dips in sales that seem uncharacteristic to the programming? Relatedly, how are sales for the 2025-26 performances progressing relative to past seasons? Are there any unexpected surges or dips in subscription or single ticket sales?
Positive Indicators of Healthy Sales: Your 2024-25 & 2025-26 sales track closely with recent seasons.
Advanced Sales
Look at a revenue sales curve for a production that is on sale but well into the future. How does it stack up to recent comparable productions? This will give you evidence to suggest if people are willing to buy at typical rates for events very far in the future. If so, that’s a good indicator that economic uncertainty is not affecting your advanced sales.
Positive Indicators of Healthy Sales: Your revenue for future productions is tracking closely with recent comparators.
Price Zones
Look at trends related to your price zones to spot changes in price sensitivity.
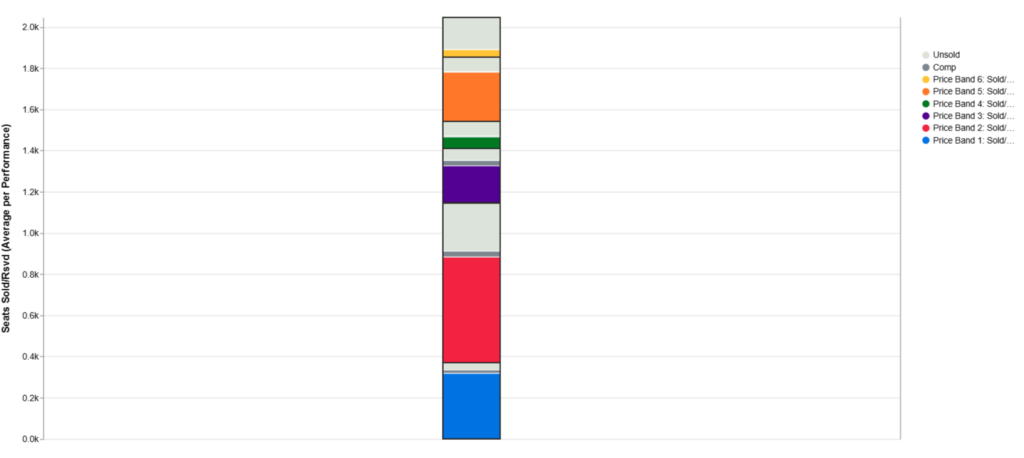
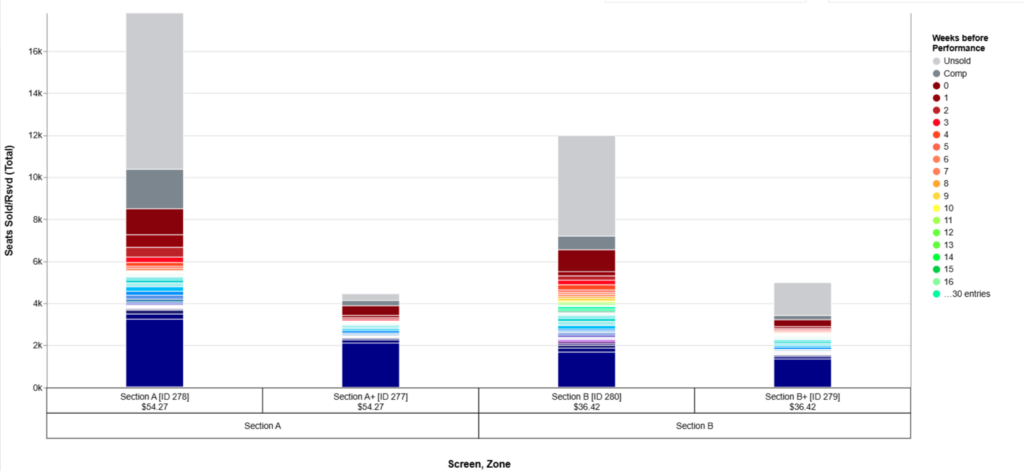
It can be helpful to look at price zones and investigate where in your venue people are buying tickets. Are your patrons buying evenly across all sections of the house? Are they buying primarily top-priced tickets and leaving the least expensive seats available? Or are your top-priced zones mostly empty while your lowest-priced tickets are sold out? You can also look at when particular price zones are selling. Are your subscribers filling up your top-priced zones before single tickets even go on sale? Are single ticket buyers rushing to find a bargain and leaving more expensive tickets available? These trends will tell you whether price resistance is a factor that you need to be concerned about. And, similar to sales curves, comparing price bands and price zones for past comparator productions can show any change in price sensitivity, too. Even if the top prices are selling, are they selling as quickly?
Positive Indicators of Healthy Sales: All zones are selling evenly, proportional to how many seats are available in each zone, with your top-priced tickets selling first and selling the most.
Price Types
Monitor sales by price type to watch for signs of your audience becoming more budget-conscious.
What types of tickets are selling? Are people buying mostly full-price tickets? Are they buying packages? Are they taking advantage of your standard discounts at a higher rate than usual (senior, student, etc.)? Comparing trends in price types across recent seasons may tip you off if your audience is becoming more price sensitive. If you notice that subscribers are suddenly downgrading to smaller packages or that your long-standing discounts (like senior discounts) are suddenly being utilized significantly more often, those might be an indication of economic strain.
Watching the performance of discounts can be a poor indicator of economic troubles, particularly because discounts are often created proactively by our organizations. It can be difficult to differentiate between your audience being budget-conscious and you sending the right offer to the right people at the right time. However, if you have proactively been offering new discounts in response to the current economic situation, it’s important to track how those discounts are performing. If you’re finding that those discounts are going mostly unused, that can be an indicator that your audience isn’t looking for discounts—and maybe any downturn in demand isn’t related to price.
Positive Indicators of Healthy Sales: You are selling mostly full-priced tickets, alongside large subscription packages. Use of standard discounts is remaining steady year over year.
Average Price vs Average Yield
Track changes in key pricing metrics from season to season and production to production, to understand how willingness to pay has changed.
There are a couple important data points that you should monitor, if you aren’t already:
Average Price: The average current ticket price offered in your venue for a given performance/production. Your potential income divided by capacity.
Average Yield: The average amount paid for a ticket. This is calculated by dividing your income by the number of seats sold.
Tracking these metrics production-by-production and year over year can tell you quite a bit about whether there may be cause for concern about the economy impacting your ticket sales. Do you know whether your average yield has increased year over year? Has it kept up with inflation? How does your average yield compare to your average price? Are these figures mostly in line, or is your average yield substantially lower than your average price?
Low average yield, and its relativity to average price, could be an indicator of price sensitivity; however, it’s important to note that it’s not necessarily an issue if your average yield declines, particularly if you’re selling out your performances! As we found in our most recent Trends in Audience Behavior Study, the largest area of growth in percentage of capacity sold was in the bottom 25% of prices. You’ll likely sell some low-price tickets to every performance, but for something really popular, those low-price tickets will likely become a hot commodity later in the sales cycle as people look for any seat, just to get into the hall. So, if those seats are coming into play close to the performance, it makes sense to expect a slight dip in your average yield as you approach a sold-out performance.
The flip side can be true too—if your average yield rises while subscription sales decline, it doesn’t necessarily mean audiences are less price sensitive. Fewer subscription sales often mean fewer tickets sold at the subscription discount, resulting in a higher average yield overall.
Positive Indicators of Healthy Sales: Your Average Price and Average Yield are steadily increasing in line with inflation.
Programming
Look at what programming is selling to assess how risky your audience is with their entertainment budget.
Finally, we encourage you to look at which performances in your season are selling the strongest. Is your audience willing to take risks on new works and unknown artists, or are they sticking to the classics? While it’s impossible to directly compare tried-and-true blockbusters to world premieres, it can be helpful to look at the trends in your audience’s desire for riskier programming. Often, we see a decrease in sales for lesser known programming when dollars are tight as people become more risk-adverse.
Look for salient changes to trends in your data. If your more artistically risky program has proven difficult to sell for years, continued challenges aren’t necessarily an indicator of economic issues. However, if you have historically had an audience that craves new, experimental works, and suddenly that audience isn’t showing up, that would be an indicator worth investigating further.
Positive Indicators of Healthy Sales: There are no meaningful changes in how different types of programming sell, season over season.
Navigating economic uncertainty is a challenge for every organization, and you are not alone. But by digging into your data, you may discover that the future isn’t quite as uncertain as you may be fearing.
Curious about your data? We can help.
JCA specializes in turning data into actionable insights that fuel strategy and drive success for performing arts organizations. And our flagship revenue management tool, Vivian, streamlines your data analysis, freeing you to focus on what matters most: crafting impactful strategies that drive your mission forward. If you need help navigating this moment of great uncertainty, we’re here to help.
Let’s Talk!