Landing Category: Hide from Search
Vivian Demo Thank you

Thank you for contacting us!
We’ll get in touch with you shortly to schedule your demo.
Trends in Audience Behavior: What’s New in 2025-26?
Thank you for requesting our study, “Trends in Audience Behavior: What’s New in 2025-26?
Please check your email for access, or read the study by clicking on the button below.
RE NXT Migration Toolkit Thank you
Thank you for contacting us!
What Happens Next?
- We’ll schedule an introductory call to discuss your migration goals and answer your questions.
- You’ll receive a customized proposal if the toolkit is a good fit.
- Our toolkit will support you through migration.
A Practical Guide to Change Management for Cultural Institutions

Blog
A Practical Guide to Change Management for Cultural Institutions

Lauren Fulthorpe
Lauren Fulthorpe is a seasoned professional dedicated to helping organizations achieve their goals by advancing their technical and operational capabilities.
Museums and cultural institutions, by nature, value permanence and tradition. They exist to preserve, educate, and inspire. So how do you manage change when the very fabric of how an institution operates needs to evolve?
When an institution moves to a new CRM, experiments with membership strategy, or changes its technology or processes, it isn’t just a technical upgrade. It’s a fundamental shift that requires careful change management. To navigate it successfully, it’s important to be thoughtful in the transition approach and recognize that successful change happens in two inseparable dimensions:
- The Gallery (The Macro): This is the building that houses the change. It includes things like technical infrastructure, strategic vision, and institutional readiness.
- The Portraits (The Micro): The personal transition, the learning curve, and the emotional response of the individuals who bring the institution to life.
If you roll out new software without properly training the staff, you have a powerful system that’s not used correctly or not used at all as people default to their old workflows. Similarly, if you inspire the staff but give them no structure, you have passion without a platform. Change is best managed when you build both The Gallery and The Portraits.
The Gallery
Before a single person can change their habits, the organization must provide the structural integrity for that change to exist. In the world of change management, we can turn to the Prosci Change Triangle (PCT)™ to ensure the structure is sound.
This means balancing three areas:
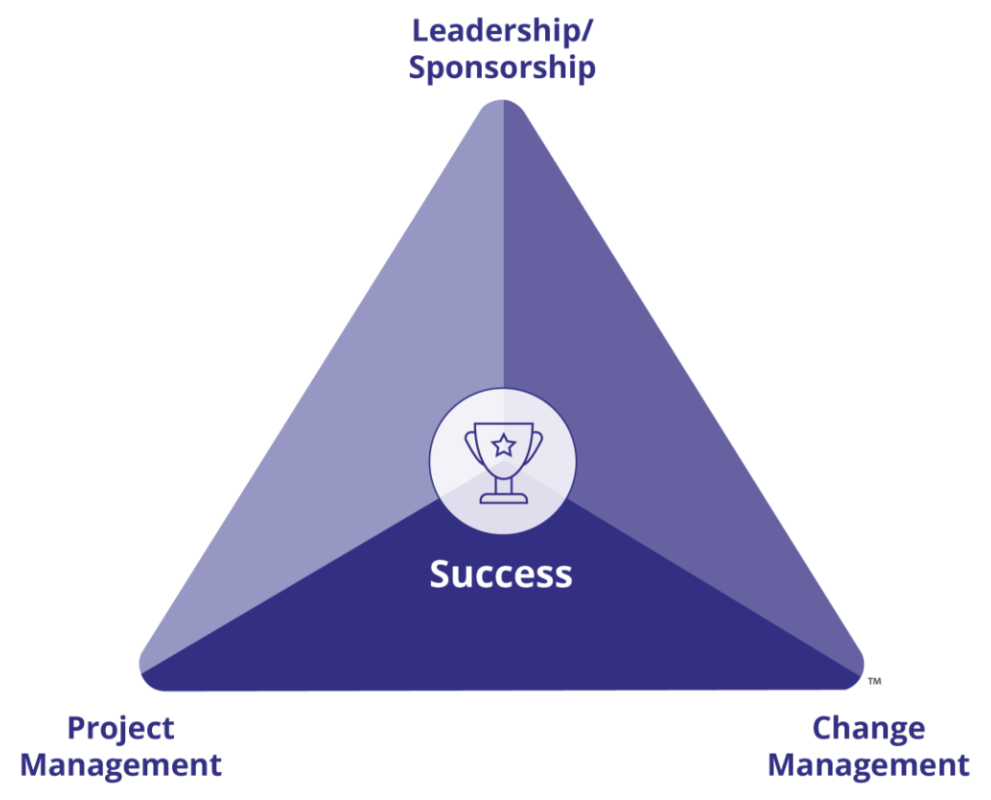
- Leadership/Sponsorship: Is leadership clear on how this project will move the needle for stakeholders?
- Project Management: Do we have the right platform and a realistic timeline?
- Change Management: Is there a structured approach to transition the staff?
The Importance of Leadership Support
With any change of this nature, the Director and Board cannot simply approve the budget and walk away. They must be active and visible. When leadership is seen championing the vision and the project, the rest of the organization views the shift as mission-critical rather than a temporary venture.
The Portraits
The organization provides the structure, but it’s individual staff members (the portraits) who make change happen. You can’t expect change to be successful if you haven’t set up the right conditions for them to learn and adapt.
Using Prosci’s ADKAR model (Awareness, Desire, Knowledge, Ability, and Reinforcement), we can guide individuals through their own personal journey of change.
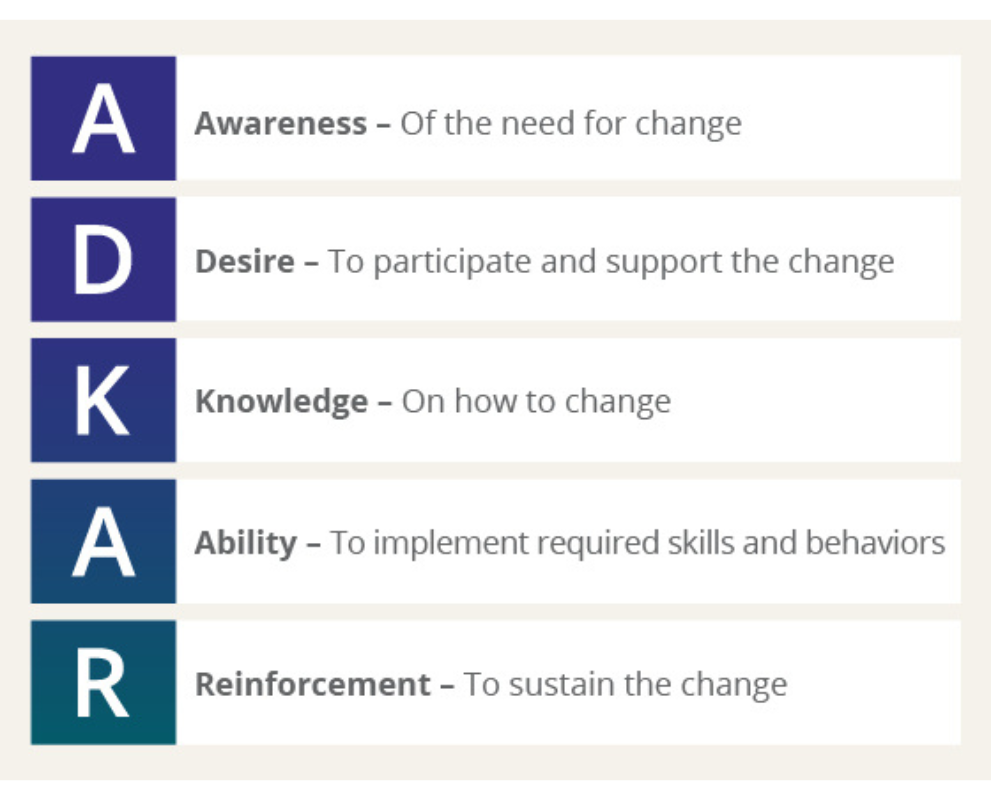
ADKAR at Work
Here are some examples of what this might look like in practice:
- Arthur the Archivist: Arthur trusts paper more than servers. He lacks the Desire to change because he fears data loss.
The Strategy: Involve him in the data-mapping process. Show him how the new system conserves his legacy more securely than a filing cabinet ever could.
- Elena the Program Manager: Elena loves the mission but is chronically short on time. She lacks the Ability to master a complex tool.
The Strategy: Provide Micro-Learning opportunities (10-minute training bursts) and safe sandboxes of the new environment where she can experiment, make mistakes without affecting live data, and provide feedback on ways the system can continue to improve.
- Sam the Fundraiser: Sam hides his donor notes to keep them clean. He lacks the Awareness of the collective benefit.
The Strategy: Show Sam how the visitor data can help him identify high-level donors he never knew existed.
Change management is not a one-size-fits-all installation. Success lies in the nuances. In the examples above, we looked beyond departmental labels to see the individuals, and our strategy involved meeting them with the specific tactics that resonated with their fears and motivations.
When you personalize support, you don’t just implement a system or launch a project; you ensure that every member of the team is set up for a successful transition.
The Installation
Once the “Why” is established and the individual needs are understood, you need a practical installation strategy.
Peer-to-peer learning
Staff are often more receptive to learning from a colleague who speaks their departmental language. This is where a change champion can be your biggest asset. These are early adopters from different departments who are respected by their peers and act as the bridge between the new system and daily workflows. For example, a change champion in the Education department can be equipped with knowledge to help translate technical CRM steps into educator-speak.
Workflow mapping
Don’t just teach the software/solution; teach the role. Reviewing the ADKAR framework, we see that Knowledge leads to Ability. It is important to show a curator or fundraiser exactly where the new system removes a manual headache from their day. This knowledge gained will positively influence their use of the new solution, building their ability.
Data as a shared resource
Use the transition to break down departmental silos. Show your teams that a Member record isn’t just for the Development office; it’s a shared history of a visitor’s relationship that helps Educators and Curators create better experiences.
Making Change Stick
The most dangerous phase of any transition can be the six-month slump, when initial excitement fades and staff revert to old habits. Here are some tips to making change stick.
- Give it time: Learning is real work. Leadership must provide the structural space for staff to master new tools, even if it means temporarily adjusting other KPIs.
- Highlight data wins: If an educator spends hours cleaning visitor data, show them the resulting insight that helped secure a new grant. When people see their data in action, the system moves from a burden to a benefit.
- Have a clear sunset date: To prevent system ghosting, set a clear date when old, redundant processes are officially retired. This provides the clarity the team needs to fully commit to the new architecture.
- Schedule a review: Treat your digital systems like a rotating gallery, not a stone monument. Schedule a review six months after launch. Ask: Is the system still serving the staff? What new workflows have emerged? This ensures the system evolves as your institution grows.
Checklist for Organizational Change
☐ Define the Success Value
- Can you explain the “Why” in two sentences without using technical jargon?
- Does the staff understand how this specific change directly supports the institution’s mission (not just the bottom line)?
- Have you communicated that data is a shared organizational asset and not just owned by one department?
☐ Secure Executive Sponsorship
- Is the Director or Board prepared to be an Executive Sponsor, visibly using the new tools and talking about the data in meetings?
- Is there a dedicated budget not just for the software, but for the time and training required to learn it?
☐ Assess Individual Readiness
- Have you assessed your team? Do you have strategies and tactics in place to ensure they are heard, supported, and understood?
☐ Appoint Change Champions
- Have you identified respected early adopters in each department to act as local experts?
- Is there a clear feedback loop for staff to report issues as they arise?
☐ Plan for Permanent Change
- Have you planned a way to celebrate the Go-Live milestone? It’s been a big endeavor – mark the occasion!
- Have you set a closing date for legacy systems to prevent double-entry and system ghosting?
- Do you have a plan to celebrate Data Wins within the first 90 days to prove the system’s value?
- Is there a scheduled review in six months to refine the system based on staff feedback?
Need Support?
Change management for cultural institutions requires both technical expertise and an understanding of how the institutions work. You don’t have to do it alone.
Our Prosci® Certified Change Management Practitioner is ready to support your journey, addressing both the technical requirements and the human reality of change.
Let’s Talk!Vivian Training Feedback Survey
Vivian Training Feedback Survey
Thank you for attending our recent Vivian training session!
We’re committed to making Vivian valuable for you. This short 6-question survey will take less than 3 minutes, and your feedback will help us improve future training sessions and the product experience.
Your responses are anonymous unless you choose to provide your email address for follow-up.
Vivian Advanced User Documentation

Vivian Advanced User Documentation
Vivian Advanced uses Artificial Intelligence (AI) to create seats and revenue forecasts and calculate the optimal single ticket price (dynamic pricing).
Machine Learning (ML) is applied to your historical data for both subscription and single ticket purchases. Similar events at your venue are grouped into clusters, and a tailored model is built for each cluster. These models reflect your organization’s event patterns, producing weekly forecasts that drive daily dynamic pricing recommendations, optimized down to the price point. The more data the ML sees, the smarter it gets. As the models gain more insights from your sales data, their recommendations become more accurate.
Ticket sales drive weekly forecast changes. Ticket prices influence forecasts only slightly, but they play a key role in price optimization. Each time you adjust prices, that new price becomes the baseline for the next day’s recommendations.
Business Impact
Enabling Vivian Advanced gives you access to the AI-generated forecasts for your upcoming productions. These forecasts are updated daily and closely track actual ticket sales, helping you make faster, more confident pricing decisions, without needing to manually select comparators.
Daily dynamic pricing recommendations by zone can guide manual price adjustments or be committed in just a few clicks, streamlining your workflow. By surfacing insights that were previously overlooked or time-consuming to manage manually, Vivian Advanced empowers you to act strategically, accelerating price changes and optimizing revenue potential.
Vivian Advanced Step-by-Step
Enabling AI Forecast
Vivian Advanced defaults to AI Forecast. You can choose between AI Forecast and Comparators Forecast. This choice will determine the values displayed in the Forecasting module and in the Monitoring Dashboard report.
- Select the “Forecasts” icon from the left-hand navigation.
- In the Forecast drawer, locate the Comparators Forecast / AI Forecast toggle to confirm AI Forecast is enabled. Click the toggle to switch between the Comparators and AI Forecast.
- Select your production or individual performance from the Forecasts table. Be sure to select your filters so the table displays.
AI Forecasted Sales Curve
The Forecast drawer is designed to easily choose between Sales and Revenue curves.
1. Select the “Forecasts” icon from the left-hand navigation.
2. In the Forecast drawer, click on Seats or Revenue to change the curve displayed.
3. Select your production or individual performance from the Forecasts table. Be sure to select your filters so the table displays.
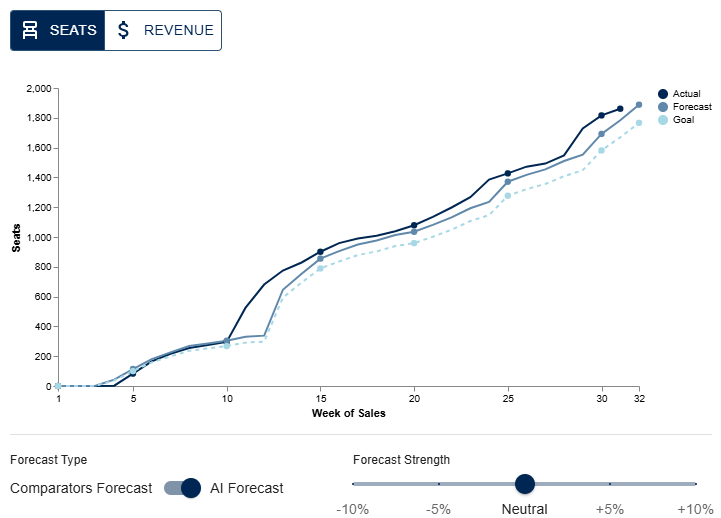
4. Optional: Click the Comparators Forecast / AI Forecast toggle to view Comparators Forecast.
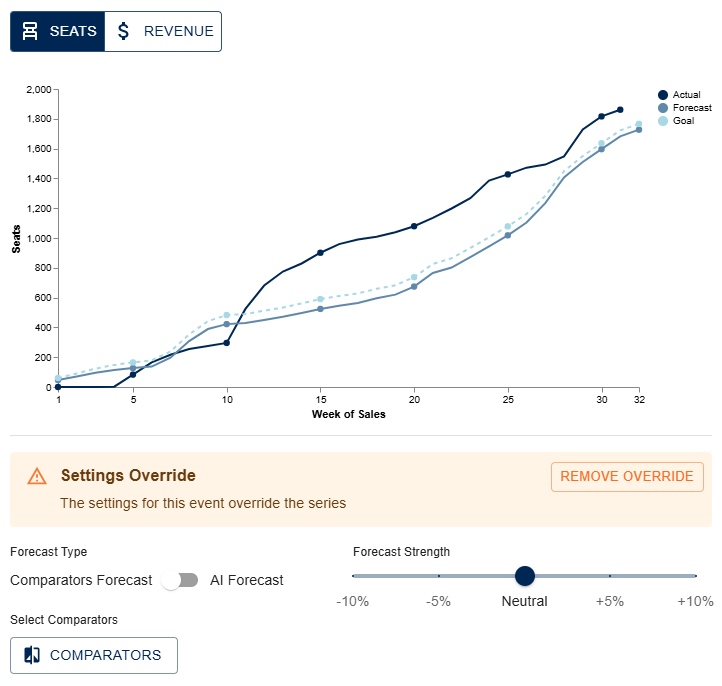
Forecast Strength
To manually adjust the forecast strength to be more or less aggressive, click on the slider that is defaulted to Neutral and drag it to -10%, -5%, +5% or +10%, based on how you want to adjust the forecast. The forecast curve will shift to the new numbers.

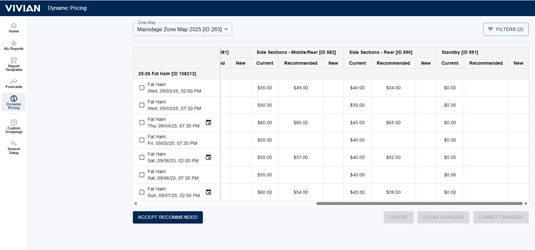
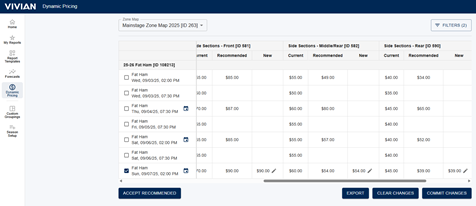
Daily Dynamic Pricing
In Vivian Advanced, daily dynamic price recommendations are populated in the “Recommended” column of the dynamic pricing module. To review and apply your daily dynamic price recommendations:
- Select the “Dynamic Pricing” icon from the left-hand navigation.
- Choose a Zone Map from the drop-down menu if you have more than one. Be sure to select your filters so the table displays.
- Click on Accept Recommended.
- Review the prices in the New column for each zone.
- Click on the pencil icon to make manual edits to the prices. Delete the price to keep the current price.
- Commit the new pricing per the current flow.

Reviewing Dynamic Pricing Recommendations
Human oversight and decision-making is integrated into Vivian Advanced’s Dynamic Pricing workflow. When first using Vivian Advanced, review the price recommendations for all your zones by scrolling to the right. You can modify or delete any recommendations that aren’t aligned with your real-world understanding of your performances.
Support
The best way to reach our team for support with Vivian is to email us directly at viviansupport@jcainc.com. Please provide details on your support issue so we can plan a quick resolution.
FAQs
Q: What is Machine Learning?
A: Machine Learning is a subset of AI that enables systems to learn from data and improve their performance over time without being explicitly programmed. Using ML over other types of AI is often preferred when the goal is to learn from data and improve performance automatically.
Q: Why use Artificial Intelligence / Machine Learning to predict event forecasts and dynamic pricing?
A: Machine Learning is well-suited for forecasting and dynamic pricing because it can handle the complexity and scale of ticketing data more effectively than traditional statistical methods. Specifically, ML:
- Captures complex patterns in sales and audience behavior
- Processes large, diverse datasets efficiently
- Adapts to changing trends
- Supports feature engineering
- Enables near real-time forecasting and pricing recommendations
Q: What ML does Vivian use?
A: Vivian is using both unsupervised and supervised learning for the Vivian ML pipelines. Unsupervised learning is used to cluster events together, similar to the manual comparator selection process, but automated. Supervised learning is then used to produce forecasts for each of those clusters, based on knowledge of the previously sold events in each cluster.
Q: What data are used in Vivian Advanced?
A: More than 10 key event characteristics, including zone map, seat map, performance type, time of day, day of week, month of year, week of run, order (show) within the run, facility, capacity, and sales are used for Vivian Advanced AI. All analysis is based solely on your organization’s data—no outside sources are used—so recommendations reflect your venue’s unique patterns and audience behavior.
Q: What does the clustering of my performances look like?
A: Some clusters will have as few as two performances, meaning they are unique. The optimal number of clusters is between five and ten, but there can be a need for more clusters for many unique performances, and it’s expected that subscriptions and single tickets will have a different number of clusters.
Q: How do the models create my forecast curves?
A: The model predicts price points and aggregates them for subscriptions and single tickets.
Q: How are my daily price recommendations calculated?
A: Every night the Daily Update pipeline runs and any new events are then classified into the existing clusters. The price recommendations in Vivian get overwritten daily, so you see new fresh data based on your current performances. Vivian Advanced applies rules to limit extreme price changes, and any recommendation that exceeds the minimum or maximum thresholds is automatically adjusted to remain within those bounds.
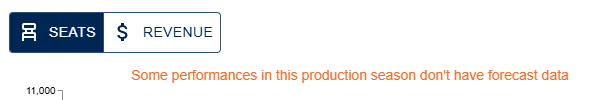
Q: Why don’t some performances have forecast data?
A: Ensure you are looking at future performances, since forecasting is about what will happen in the future. Also, Vivian gets nightly updates of your data from Tessitura, and with all data management, regular work is required to ensure data quality and resolve expected data errors that could affect forecast or price recommendations.
Q: How do we know the ML models are making good predictions?
A: Models are evaluated through a combination of evaluation techniques, validation strategies, and interpretability tools. For Vivian Advanced, the forecast prototype models were evaluated using the mean-squared error (MSE) metric, which evaluated the type of model that would be best.
Data Governance Template Review
Data Governance Template Review
You’ve started the journey, but turning templates into a valuable, working data governance framework can be a challenge.
Let us help. Enter your details below for a complimentary review of your templates, and we’ll show you how to maximize your results.
If you’re not sure how to use these resources, we can help with that, too.
"*" indicates required fields
Data Governance Templates

Download Your Data Governance Templates
We know that effective data governance starts with a clear understanding of your data landscape. We’ve created three go-to documents—a Business Glossary, a Data Sources Inventory, and a Data Quality Issues Log—to help you enhance data quality, improve collaboration, and make more informed decisions. Each document is a powerful tool on its own, and together, they are designed to form a strong foundation for managing your organization’s data.

Let’s Get Started
These documents are designed to be a practical starting point for your data governance journey. We encourage you to download and use them to begin building a more trusted and reliable data environment.
Business Glossary
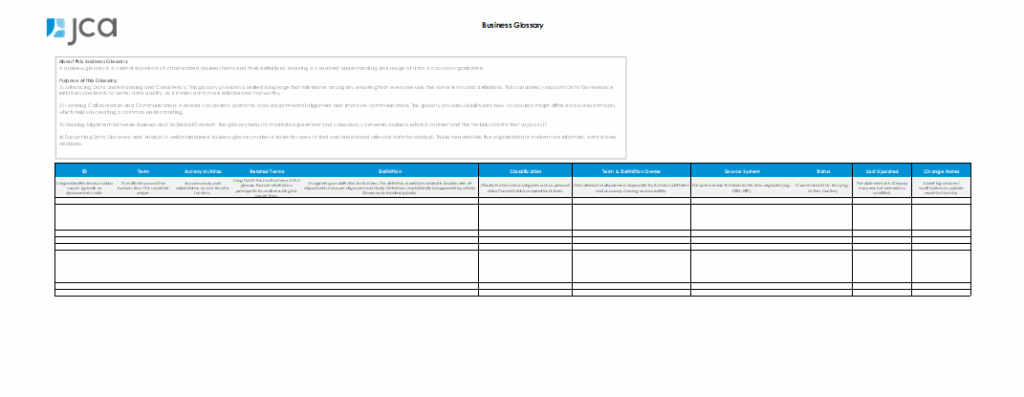
The Business Glossary provides a unified, authoritative dictionary for all of your organization’s terms. This ensures everyone, from development to program staff, is using the same language. For example, if your fundraising team defines a “donor” as anyone who has given in the last two years, but your community giving team only includes those who’ve given over a certain amount, their numbers and messaging won’t align. By standardizing these terms, the glossary eliminates confusion and improves communication and data consistency.
Data Sources Inventory
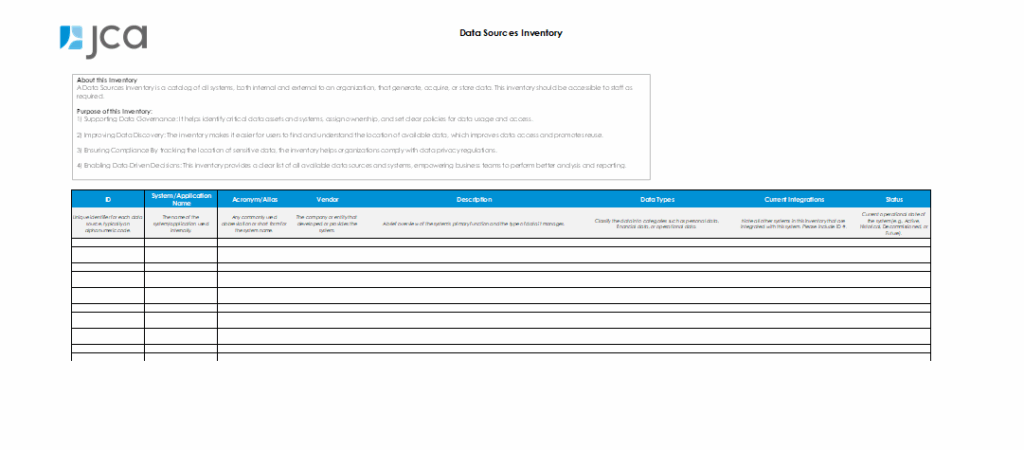
The Data Sources Inventory is a comprehensive map of where your data lives. It catalogs all the systems—like your donor management, volunteer, or program tracking databases—that create or store data. This is crucial for data discovery and demonstrating accountability. If your organization needs to identify all systems containing sensitive donor information to ensure privacy, the inventory provides a quick and accurate reference, building trust and helping to meet compliance requirements.
Data Quality Issues Log
The Data Quality Issues Log is a dynamic tracker for every data problem. It helps your organization move from a reactive approach to a proactive one by documenting, managing, and resolving data issues systematically. When a Major Gift officer notices incorrect figures on their pipeline report, they can log the problem here. This allows the organization to track and prioritize the issue, understand and fix the root cause, and prevent it from recurring.
We’re here to help!
Whether you have feedback on the templates or need expert support building your data governance strategy, our team is ready to assist. Don’t hesitate to reach out to us here or at smarter@jcainc.com.
Trends in Audience Behavior: What’s Changed in 2025?
Thank you for requesting our study, “Trends in Audience Behavior: What’s Changed in 2025?
Please check your email for access, or read the study by clicking on the button below.