Success Story | How Ballet Arizona’s Optimized Seating Chart Played a Role in a Record-Breaking Nutcracker

Jennifer Nemeth
Manager, Professional Services
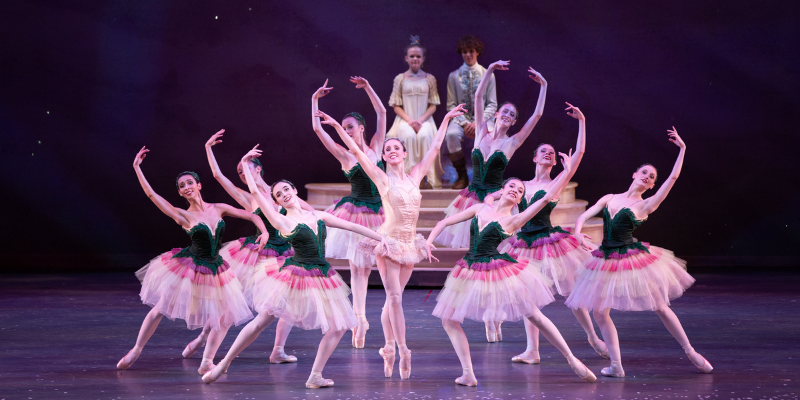
Ballet Arizona dances in Ib Andersen’s The Nutcracker. Photo by Rosalie O’Connor.
An optimized seat map and pricing structure are critical for the financial success of any performing arts organization. When your seat map is functioning well, you’ll put your organization in the best possible position to sell more tickets, make more revenue, be accessible to more ticket buyers, and free up staff time to handle other tasks. A perfect example of this is from our recent engagement with Ballet Arizona.
In 2019, Ballet Arizona engaged JCA Arts Marketing to complete a Pricing Study, with the goal of rezoning and rescaling their venue. For years leading up to the Pricing Study, staff had recognized that the previous seat map was not meeting their needs. There were several issues with the map including:
- Some sections were consistently filling up, while others barely sold.
- There were large holes in the house that staff had to spend time and energy to fill.
- Staff was putting in too much manual effort to make sure the right prices and seats were available at the right times.
- The organization has one production (The Nutcracker) that sells drastically differently from everything else, and the existing map wasn’t meeting the needs of all its productions.
- The existing map included the requirement of multiple seat releases which restricted ticket buyers’ options and required extra work from staff to manage.
To address these issues, JCA Arts Marketing completed an in-depth analysis of the organization’s sales patterns to optimize the seat map and better meet the needs of both ticket buyers and staff. The analysis included a deep dive into measures such as speed of sales, sales by price type and band, and heat maps. These provided valuable insight into ticket buyers’ seating and price preferences.
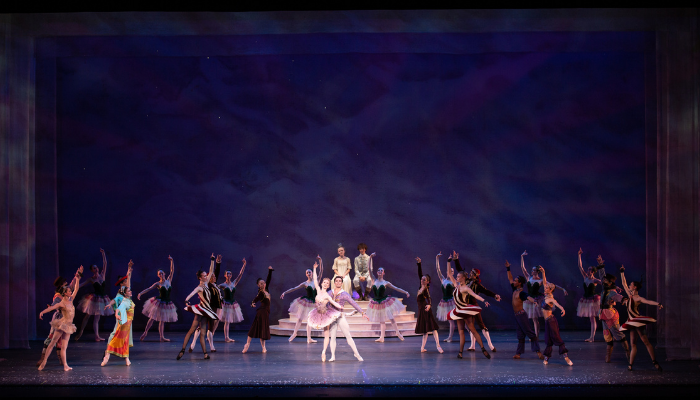
Ballet Arizona dances in Ib Andersen’s The Nutcracker. Photo by Rosalie O’Connor.
The resulting recommendation of a new seat map and updated pricing solved the issues mentioned above by:
- Creating one map for most productions, and a slightly different map for The Nutcracker. The Nutcracker map includes more seats at higher prices and a special Premium section to account for higher demand.
- Eliminating the need for multiple releases by creating a map that will provide the desired house fill without keeping many seats held.
- Adjusting the sections so that the price and value was matched for each seat in the house—raising prices on seats that were previously undervalued and decreasing prices on those that weren’t as popular.
Staff at Ballet Arizona were excited to put the learnings from the pricing study into practice. However, due to the timing of the pandemic, it wasn’t until the 2021-22 season that the new map was finally implemented.
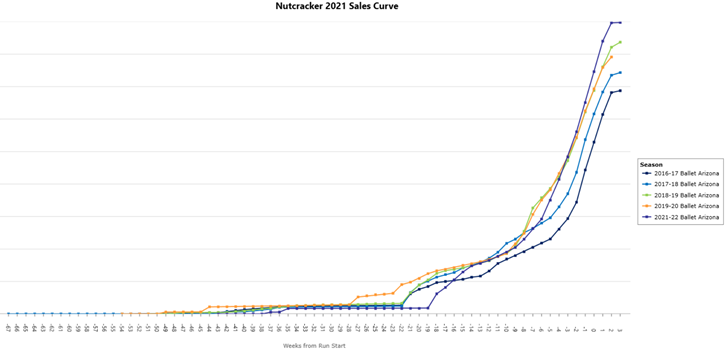
As it turns out, it was worth the wait. In 2021, The Nutcracker was the highest grossing Nutcracker season in the organization’s recorded history. In 2021 Ballet Arizona saw a 7.3% increase in revenue and an 8.4% increase in ticket sales. The new seat map contributed to this increase in sales by optimizing the price of each seat in the auditorium according to the perception of its value.
Here’s the evidence of the new seats map’s positive impact on sales:
- The average starting price* of tickets was actually 4.1% lower than in previous years due to the new seat map, which increased the number of tickets available at lower price points. The prices were not actually lowered in the new seat map, in fact the prices were increased from previous years, but offering more seats at low price points brought the overall average price of the house down.
- The average yield* per ticket was 1.3% lower than previous years, proving that a higher average yield doesn’t always lead to more revenue. Selling more seats, even at lower prices, is an important part of the equation. In previous years, Ballet Arizona did not have enough low-priced seats to meet demand. By adding additional seats in the low-priced sections, they were able to sell more tickets.
- There was much less need for discounting in 2021, because there were plenty of seats available at lower prices already, and the house filled in an ideal pattern without the need for discounting. Discount drift* dropped to 9.5% in 2021, compared to 16% the prior year and over 26% in earlier years.
- Staff had to do significantly less dynamic pricing than in past years, because the house was already priced well. This reduced the staff time and effort needed for ongoing price changes, freeing them up to focus on other tasks. Dynamic pricing changes accounted for 2.6% of revenue in 2021, compared with 6.7% in prior years, yet the 2021 overall revenue was higher.
The team at Ballet Arizona is thrilled with these results! Going forward, the team will work with JCA to will monitor demand and adjust accordingly to ensure that the seat map and associated prices continue to match audiences’ perceptions of value.
*Definitions:
Average Starting Price: The average price offered in the venue when the performance went on sale. Calculated as starting potential income divided by total number of seats.
Average Yield: The average amount paid for a ticket. Calculated as total income divided by seats sold.
Discount Drift: The difference between average price and average yield, expressed as a percentage of the average price.
In need of a re-scale? Let us know!
JCA Arts Marketing consultants are experts at scaling theatres to match audiences’ perceptions of value, resulting in higher tickets sales and revenue.