RMA Feature Focus: Planning for the Unknown

Jennifer Nemeth
Manager, Professional Services
With stages dark and many organizations selling limited tickets, we’ve received several questions about how to make use of the RMA during this time. We’d like to take this opportunity to highlight some features and reports, and how they can be useful, even if you’re not actively selling tickets.
REVIEW YOUR SEAT MAPS
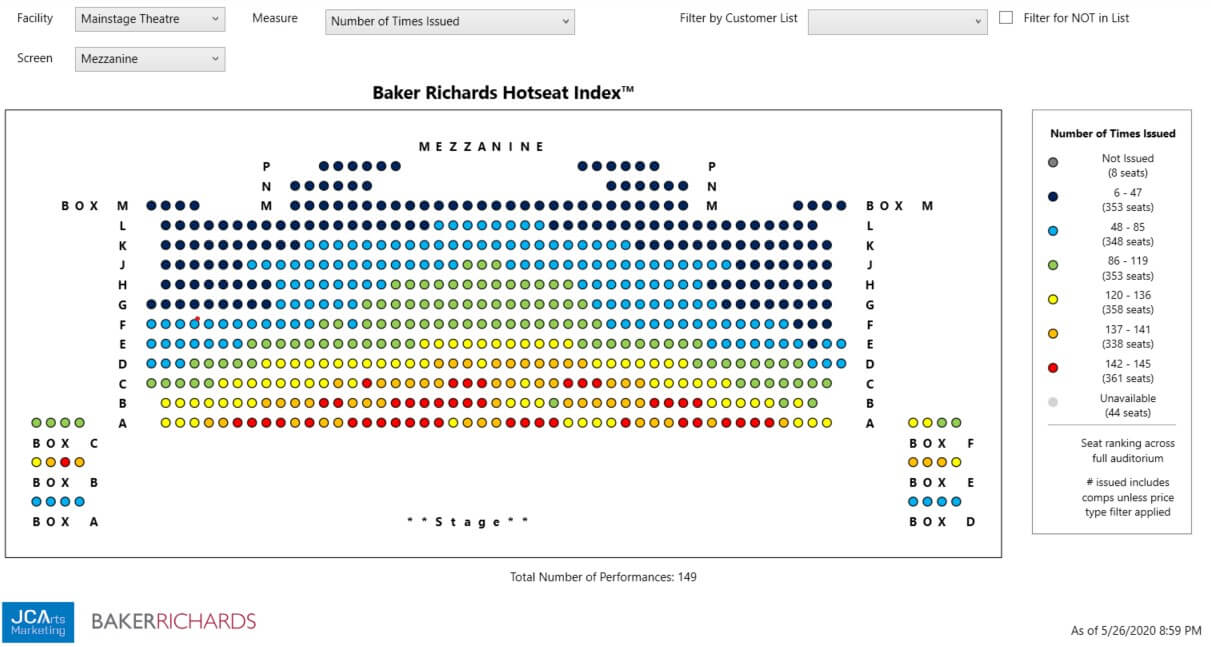
One valuable tool that you have at your disposal in the RMA is the Baker Richards Hotseat Index. We always recommend that you spend some time looking at the Hotseat Index at the end of each season, to review the year’s seating patterns. You may find small adjustments to make as you go into single ticket sales for the upcoming season, to either increase income from particular seats by bumping them up a price point, or create a better fill pattern by bumping seats down a price point.
Doing this work in the Hotseat Index is especially important, as you’re planning for an upcoming season with a lot of unknowns. You can use the Hotseat Index to find places to make small adjustments, plan for flexibility with your seating, and create contingency plans.
When you’re looking to review and adjust your seat map, start by filtering for a large number of performances from your previous season. You might want to filter by genre, performance type, or other characteristics that affect how a performance sells; or, you might want to include the entire season in a single report. You may also want to filter by price type and remove complimentary tickets, staff tickets, and third-party sales (or any ticket types that your box office typically seats), to better see the seats customers are choosing themselves.

Once you’ve chosen your filters, start with the measure Number of Times Issued. This report will tell you how many times each seat has been issued for the performances in your filters. Pay special attention to the areas around price breaks. If the back portion of a zone is consistently not filling, it might be a sign that the zone is too big, and the fill pattern of the house might benefit from making it smaller. Or, if a zone is always full, it might benefit your bottom line to increase the number of seats in that zone.
Another useful measure is Speed of Sales, which will tell you how many days before the performance a seat typically sold. When you’re using this measure, consider filtering out subscription tickets, since those are typically purchased earlier than single tickets. Then, looking at the speed of sales map for single tickets, look for areas of the house that always sell first. Is there an opportunity to increase prices on those seats? Also look for areas that tend to sell last: Are there any adjustments you can make to help them fill earlier?
CONTINGENCY PLANNING
With so much uncertainty surrounding the upcoming season, it may also be helpful to build flexibility into your seat map now, to make changes easier on yourself later. For example, consider adding some micro-zones around price breaks, so that you can easily switch the price of those seats between the higher or lower price. This will give you the flexibility to adjust inventory while maintaining the availability of both prices. Pay special attention to areas at risk for creating holes, or where you are concerned about decreased demand.
If you’re considering the option to open with socially distanced seating in your house, take advantage of the information your Hotseat Index provides when creating those plans. Use the Hotseat Index to see which seats fill most often, so that you can maximize the availability of those popular seats. And, use it to help you re-zone and price seats in your new spaced out configuration.
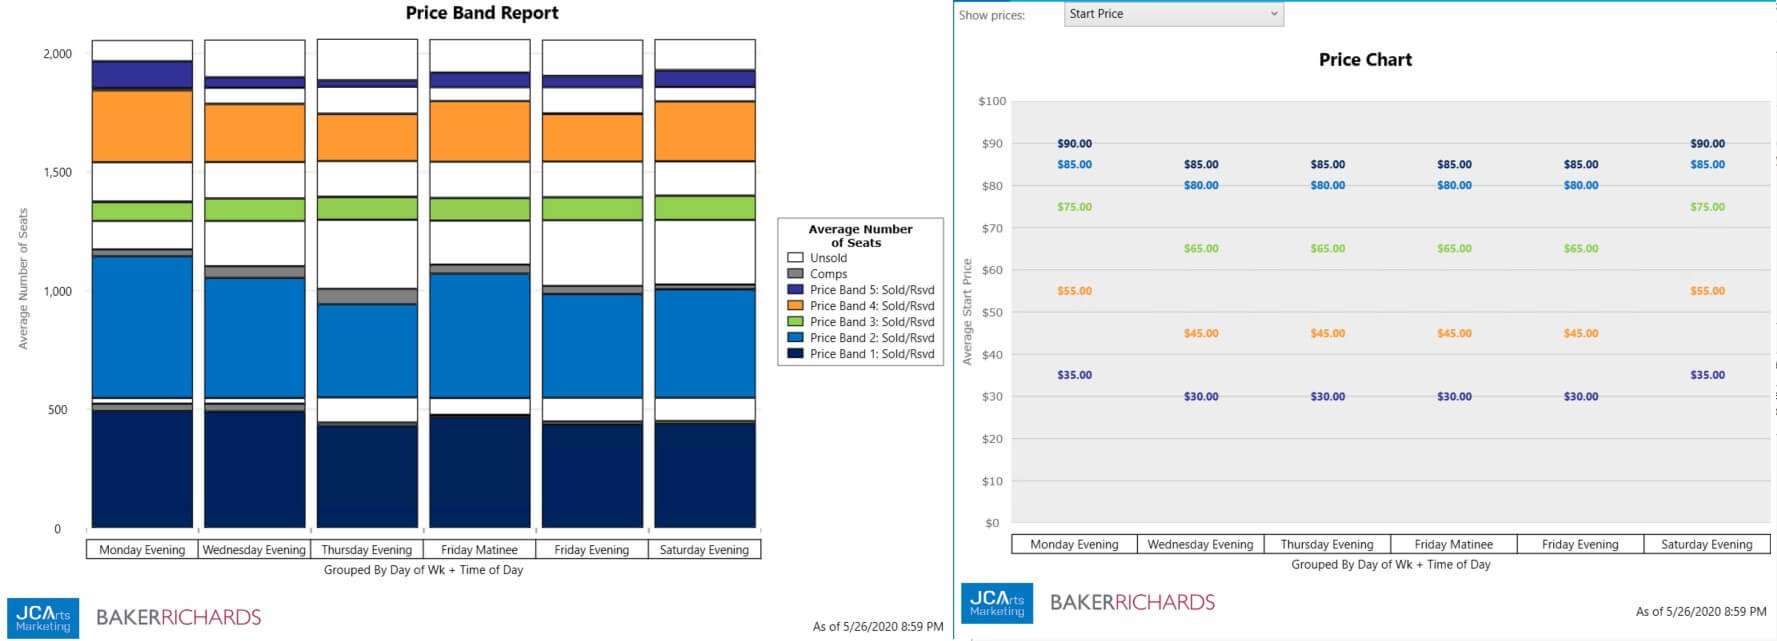
Another helpful tool for planning around socially distanced seating is the Price Band Chart. Use the Price Band Chart to understand what proportion of your audience typically buys at each price point, and use that to guide the number of seats you set at each price in your new map. And, don’t forget about the simple but incredibly useful Price Chart, which will display the starting or ending prices for each price band. The Hotseat Index, Price Band Chart, and Price Chart are your power trio of reports for setting new pricing and scaling!

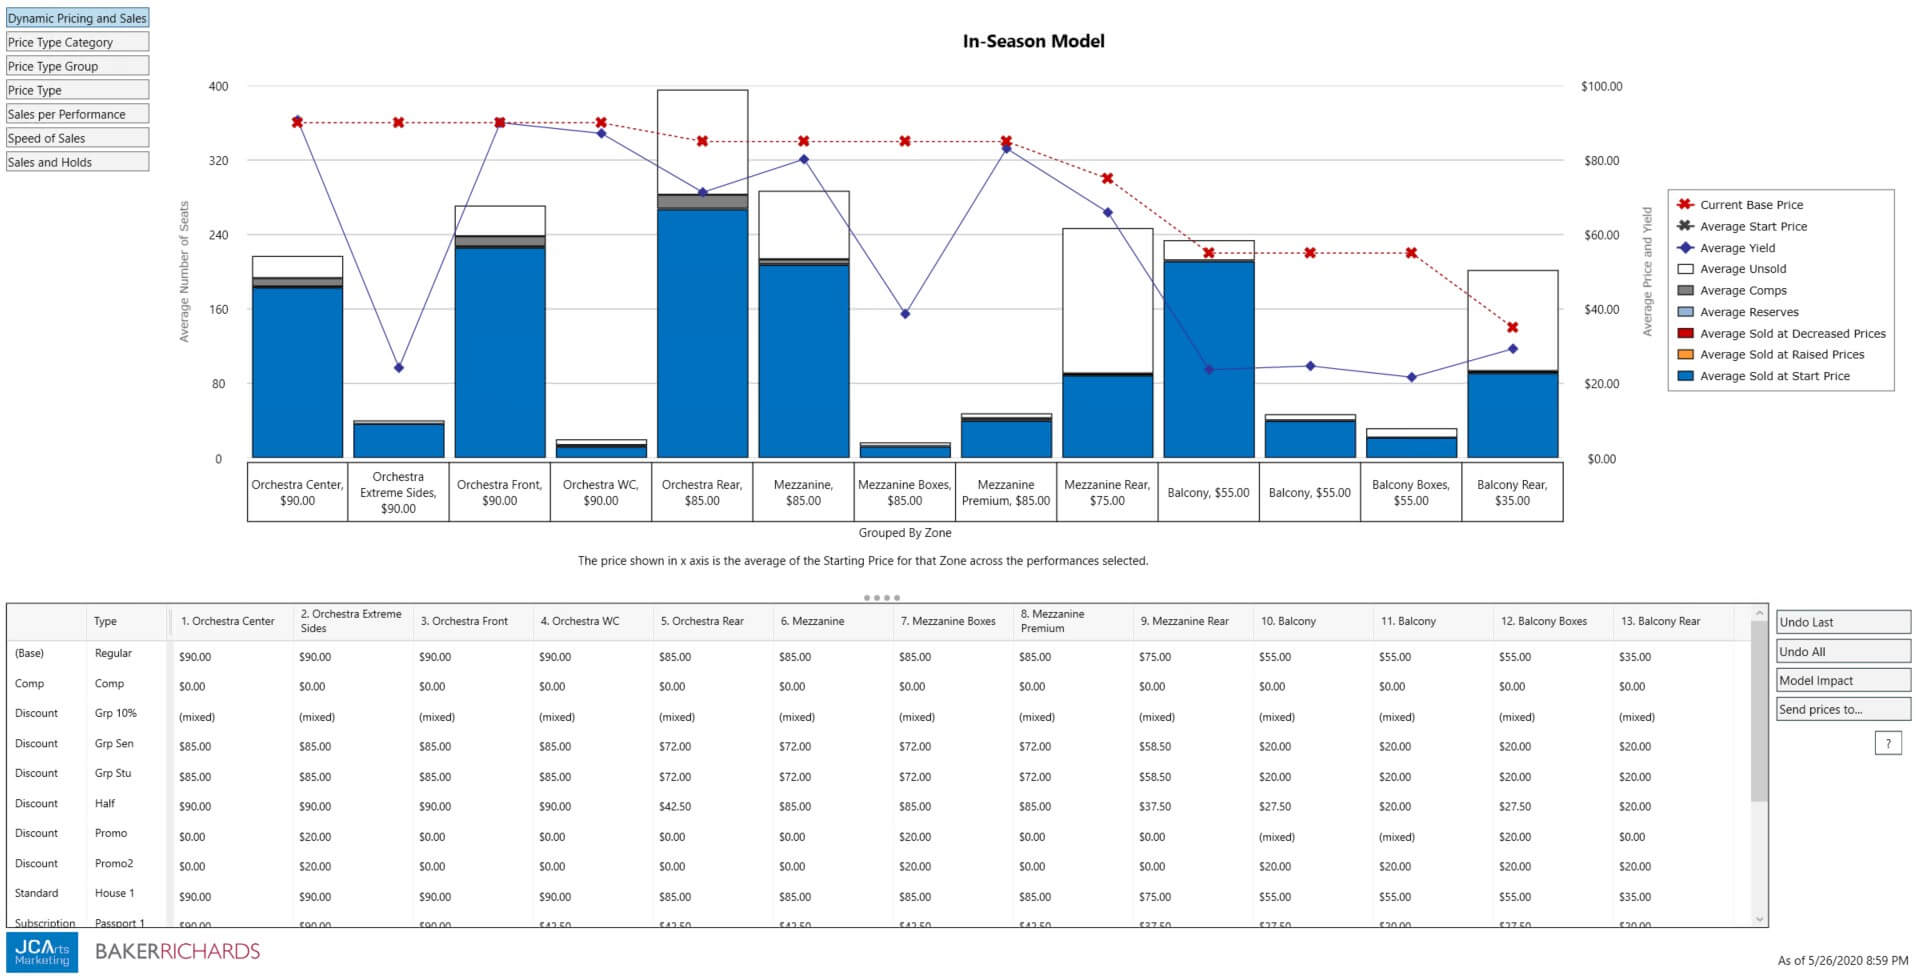
If you’ve built seat maps in Tessitura for socially distanced seating and need to do revenue modeling for the new map, try using the In-Season Model. In the In-Season Model, you can edit your prices in the report, without actually making the changes in Tessitura. Then, choose Model Impact to see potential income numbers, given your new prices. You can further adjust your percent discount drift and expected percent capacity sold within the model, to help with making predictions and budgeting. If you decide you’re ready to make the price changes, simply choose Send Prices to… to update the prices directly in Tessitura!

TRACK RETURNED TICKETS
During this time, it will be important to understand which performances have an excess of patrons returning or exchanging tickets. In RMA version 6.1, we introduced new measures to track returned and donated tickets. Make sure to include these measures in your dashboards for the upcoming season by adding the Sales, Returns & Capacity and the Income, Returns & Capacity widgets. These widgets will help you recognize volatility quickly, so that you can take action to fill those performances via strategic discounting and offers.

FORECASTING
Finally, don’t discount the benefit that the RMA can provide you when forecasting, even with the unknowns ahead! We’ve written before about what to consider when forecasting. And we’ve also shared with you how to use the new Production Wizard. It may feel like all the traditional forecasting methods have gone out the window as you try to budget for a giant set of unknowns, but it can still provide a really important starting place. It’s much easier to start from “here’s what we’d budget if this were a typical season, now let’s make adjustments” than “we’re throwing numbers against a wall and hoping they stick.”
Of course, it would be even better to do primary research to better understand what your audience is willing to pay and their willingness to return. If you’re not able to take on primary research, then you can make educated adjustments to your typical forecasts by using available industry research. In order to make those adjustments, you will need somewhere to start, and that is where RMA comes in! Don’t forget that you can edit forecasts within the RMA. So, if your research tells you to expect 65% of your usual audience, you can create your forecast in the RMA as usual, and adjust it down 35%.
We know it is a challenging time for every arts organization, but we hope that the RMA, and these tips, can help you evaluate your current pricing practices and better plan for the future, no matter how uncertain.
If you have any questions about how to use the reports or measures outlined above, please write us at rma@jcainc.com. .

