RMA Feature Focus: Utilizing the Pre-Season Model to Forecast for Future Performances

Many organizations are preparing for a season like no other. Whether you are setting up virtual tours, streamed performances, or socially distanced live events, careful planning has been crucial to your organization’s survival. Eventually, this too shall pass, and with the potential to move back to live performances this coming spring, it will be crucial for organizations to accurately model income for future performances, and the RMA’s Pre-Season Model is the perfect tool for this.
PRE-SEASON MODEL
Ideally, when creating prices for your season and modelling income, you would do so prior to building events in Tessitura. The RMA Pre-Season Model is an excellent tool to use at this stage of your planning. It provides quick access to zone reports with prices of past comparators, as well as the ability to model price changes to those zones, combined to form an easy and effective tool to forecast your upcoming season’s income.
1. Setting up the Pre-Season Model Report
The first step is to set up the proper filters within the Edit tab. The Pre-Season Model itself will use zone reports and your pricing grid, so it is important to make sure that you are selecting performances that use the same zone map, as well as approximately the same prices and price types. You’re selecting Comparator performances here, just as you would in the Forecasting Module. This allows you to use the Pre-Season Model even before the performances you’re modelling for have been built.
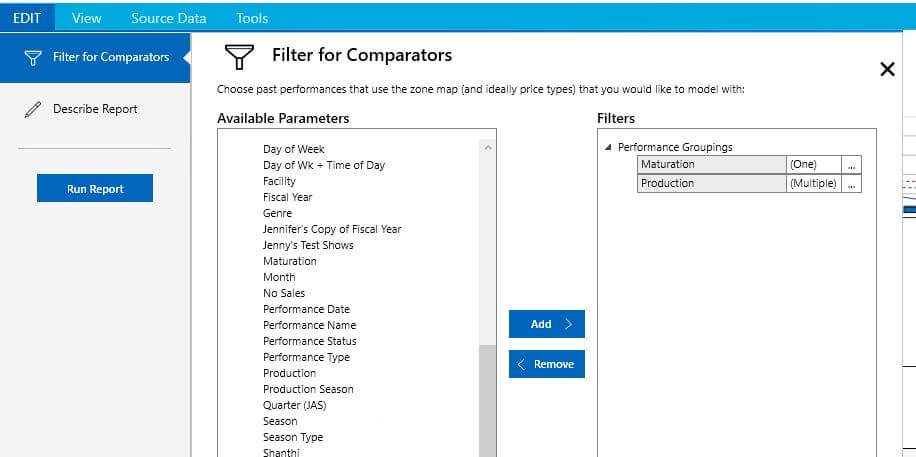
As a default, the filtering panel includes the Maturation Filter with only past performances selected. If your performances are already on sale and you are looking for a way to estimate potential income from dynamic ticket pricing, you will want to use the In-Season Model instead.
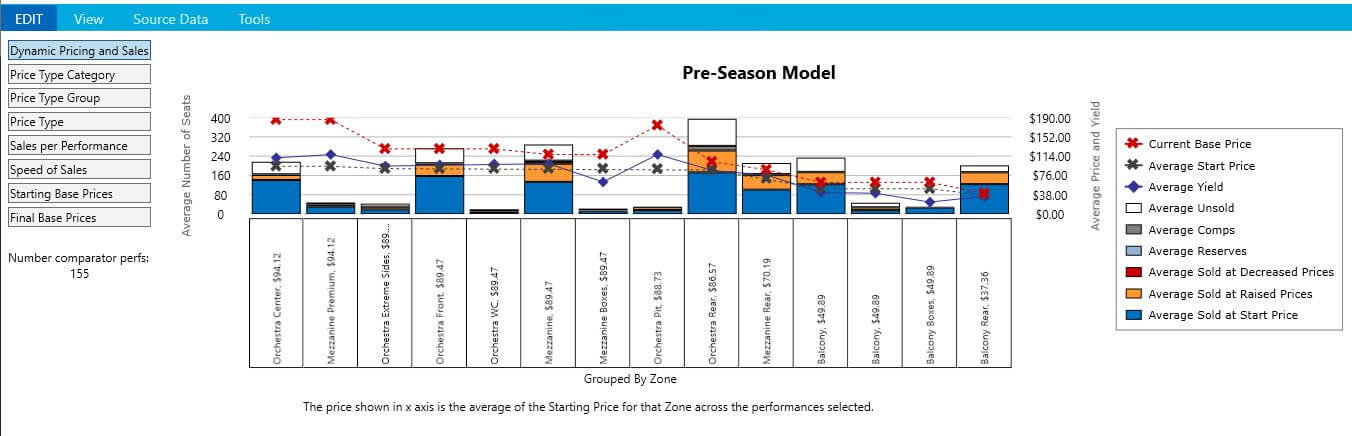
After running the report, you’ll see a split screen, with the top half of the Pre-Season Model showing the Zone Reports, and the bottom half showing a Price Grid.
2. Reviewing the Zone Report
The Zone Reports found in the Pre-Season Model provide a way for you to view sales from past performances, to aid in pricing decisions for your future performance. These reports include helpful breakdowns such as sales by price type, speed of sales, and sales per performance. This will help you determine whether the performances you have selected are good comparators, and where you might want to make changes for future performances.
A helpful feature of these Zone Reports is the option to view both average starting base prices and average final base prices in each zone for the comparator performances you’ve chosen. This will show you where you raised or lowered prices in the past, so that you can adjust your starting price for this upcoming performance accordingly.
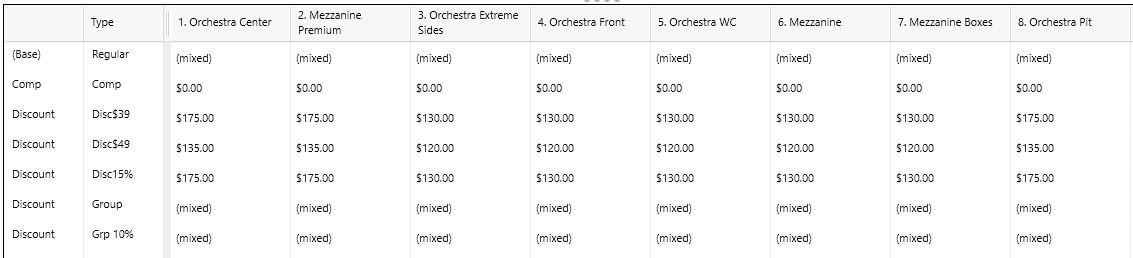
3. Adjusting the Price Grid
The Price Grid shows all of the final prices, zones, and available price types, just like you would see in Tessitura. If you are comparing multiple performances within a production, cells may say “mixed” (instead of the actual price), if the final price was different for different performances.
If you would like to edit any of the prices for modeling, select the cell you would like to update and enter the desired amount. (You can select multiple cells at once, and then right click to edit the price.) Any cell with a raised price will turn green and any cell with a lowered price will turn red. “Mixed” cells with prices entered will turn blue-gray. You can type +/- a certain amount or percentage, to edit all of the cells accordingly.
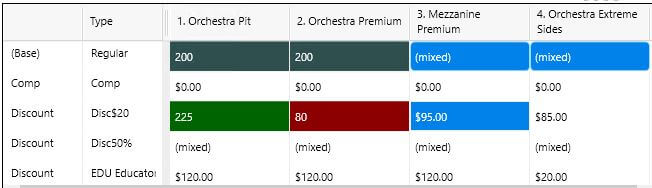
Once you have completed your edits, select the “Model Income” button on the right to view the results.
4. Model Income
Within the Model Income are Current, Model, and Sell-out Yield Scenarios columns:
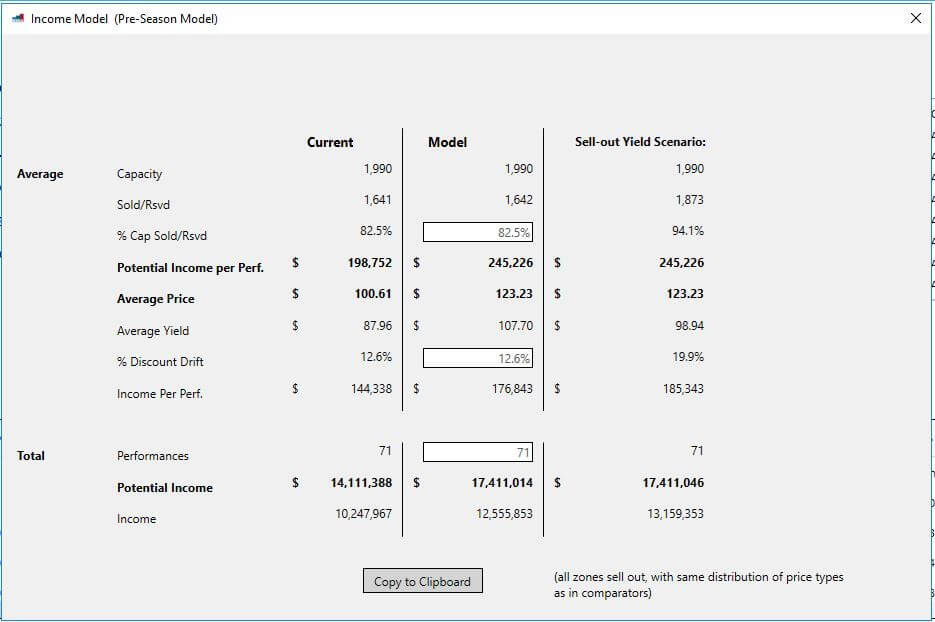
The Current column shows the final numbers of the performances in your filter. The Model column shows the effects of the edits you made on the Price Grid. Within the Model Column, you also have the opportunity to adjust the % Cap Sold/Reserved, the % Discount Drift, and the number of Performances. The ability to adjust percent capacity sold allows you to account for changes in capacity for upcoming performances, whether due to intentionally limiting the capacity of your house, or due to anticipation of lower attendance as audiences begin attending events again.
The Sell-out Yield Scenario show how much revenue can potentially be made, if you were to sell out all of your performances with the same distribution of price types as the comparator performances.
These different scenarios, along with the rest of the data in the Pre-Season Model, are designed to help you zero in on the expected and potential income for your upcoming performance, and to assist with both setting prices and forecasting revenue, before you’ve even built the performance in Tessitura.
WE’RE HERE TO HELP.
Along with the Pre-Season Model, the RMA offers a variety of tools that can help your organization maximize revenue generated from ticket sales. JCA has more tips and tricks to share about the RMA, as well as offering training and consultation. If you have any questions, please contact us at smarter@jcainc.com.