RMA Feature Focus: Weekly Wrap Report


Jennifer Nemeth
Manager, Professional Services
It’s Monday morning, and your Director wants to review sales for the week. She prefers to see numbers (rather than sexy charts) and the data arranged in a very specific order that is not accommodated by your standard wrap report. Where can you go to provide what she’s looking for in the RMA? Here’s my suggestion—start with the weekly wrap report. This report will make your Monday mornings easier, as it’s easy to build, easy to understand, and easy to share.
What is the Weekly Wrap Report?
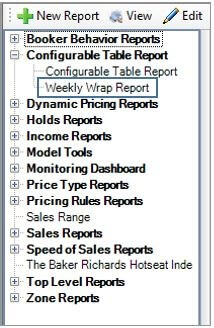
The Weekly Wrap Report is a table report in the RMA. It can be found in the Configurable Table Report folder under New Report Templates.
I like to use the Weekly Wrap Report as my starting point when I enter the RMA. Then, once I know which performances are selling best this week, I know where to focus my attention when I go to my dashboard and zone reports.
This report is ideal for keeping tabs on your inventory and viewing weekly sales numbers. It displays the number (and value!) of seats sold, reserved, held, and available for each Performance (or Production Season, if you wish). In addition, it tells you the number of seats (and/or amount of income) sold each week, in a sortable column, so that you can easily bring your best-selling performances to the top.
How do I use the Weekly Wrap Report?
In the report wizard, you’ll choose your filters as you would with any report in the RMA. In this case, I’ve chosen one Production Season in my filters.
The second tab is unique to this report. This is where we choose our grouping, as well as which measures we’d like to include. Since I’ve only chosen one Production Season in my filters, I’m going to group by Unique Performance.
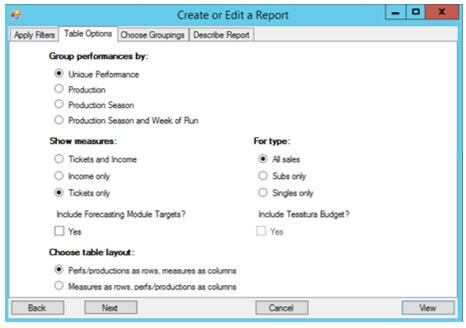
Then, I can choose whether I want to see tickets, income, or both. In this case, I’m going to choose Tickets only, to see which performances are most popular.
You have the additional option to choose between Subs, Singles, or all sold. And, if you use the Forecasting Module in the RMA, or the Budget field in Tessitura, you can display those on the report as well.
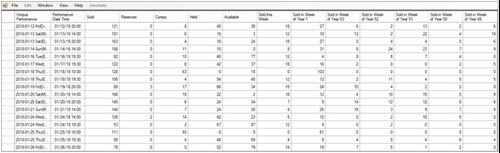
Finally, you can choose which orientation you’d prefer to view the report. Once you’ve chosen all of your table options, you can view the report. With the options chosen above, it will look like this:
How do I use this report?
In my report, the first few columns display the availability information for each performance. The following columns are where you’ll see the number of tickets Sold This Week, followed by Sold in Week of Year ##. Unlike some reports in the RMA that give you relative dates (like, weeks before performance), this report works in absolute dates, where Week of Year 1 is, in fact, the first week of the year. This screenshot was captured on January 12th, which is Week of Year 2—the second week in January.
Clicking on any of the headers will make the report sort lowest/highest or highest/lowest. This allows you to easily find your bestselling performances, by pulling them to the top. Once you know which performances have sold the most tickets in the last week or several weeks, it can serve as a guide for what to focus on when you go to your dashboard and zone reports.
Another great aspect of this report is how easy it is to share, even with colleagues who don’t use the RMA. The headers are self-explanatory enough that even your least tech-inclined coworkers should have no problem understanding the content! Just like with other table reports in the RMA, if you click on the top left-most cell, it will highlight the entire report. Then, just copy and paste into a spreadsheet to format and share to your heart’s content.
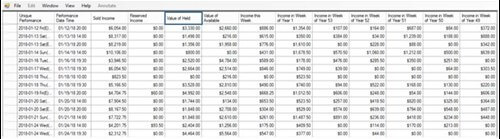
One last tip: In the screenshot below, I’ve changed the measure to Income only. So, instead of showing me the number of seats in each category, I’m seeing the value of those seats. In this view, I often find that the Value of Held column can be particularly insightful. If you’re an organization that struggles to get holds released in a timely manner, knowing the monetary value of those seats can be a powerful tool.
I hope the Weekly Wrap Report adds another tool to your RMA toolbox.