RMA Feature Focus: Tracking Holiday Shows


Jennifer Nemeth
Manager, Professional Services
The Holiday Season is upon us, along with all of those festive holiday performances! I know that there can be some extra pressure to fill up holiday performances, especially the ones that fall directly on special days like New Year’s Eve and the days leading up to Christmas. These are performances where day of week is mostly irrelevant, it’s all about when they fall around the holidays. Watching the sales slowly tick up on these high-pressure performances can be nerve-wracking, so I’m here to show you a couple of RMA reports that can help soothe those nerves and give you some yuletide confidence.
Sales by Weeks To/From
First up, one of my absolute favorite reports, Sales by Weeks To/From. You might remember this report from version 5 of the RMA, when it was called “Sales by Weeks before Performance.” The name has changed in version 6 to match some added functionality – you can now choose your anchor!
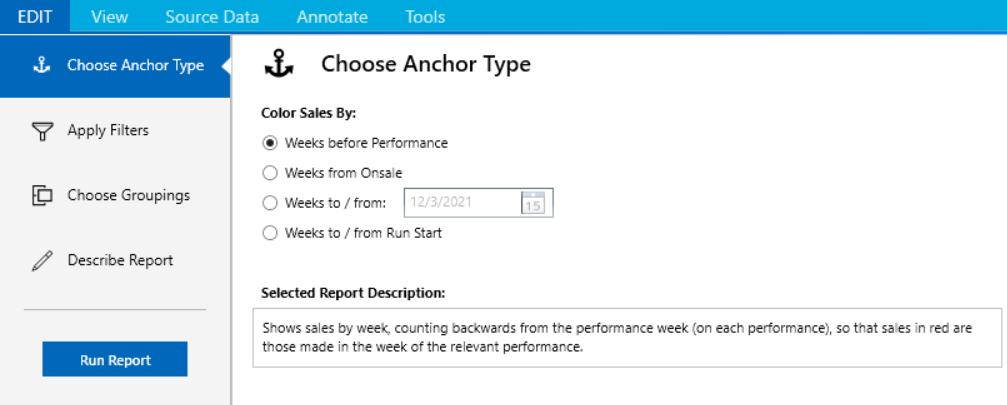
If you want to stick with the classic view of the report, choose the anchor “Weeks before Performance,” but try the other anchors to gain additional insights about your data. For example, if you want to understand how a production sold over the entire run, the “Weeks to/from Run Start” is the right anchor for that analysis.
In this case, I do want to use the classic “Weeks before Performance” anchor. I want to find out whether my performances on 12/23 and 12/26 are on track to sell out, because sales feel slow, and I’m getting nervous. So, I filtered this report for past performances on 12/23 and 12/26 using the Performance Date filter. Then I grouped the report on Fiscal Year, Performance Date, and Time of Day.
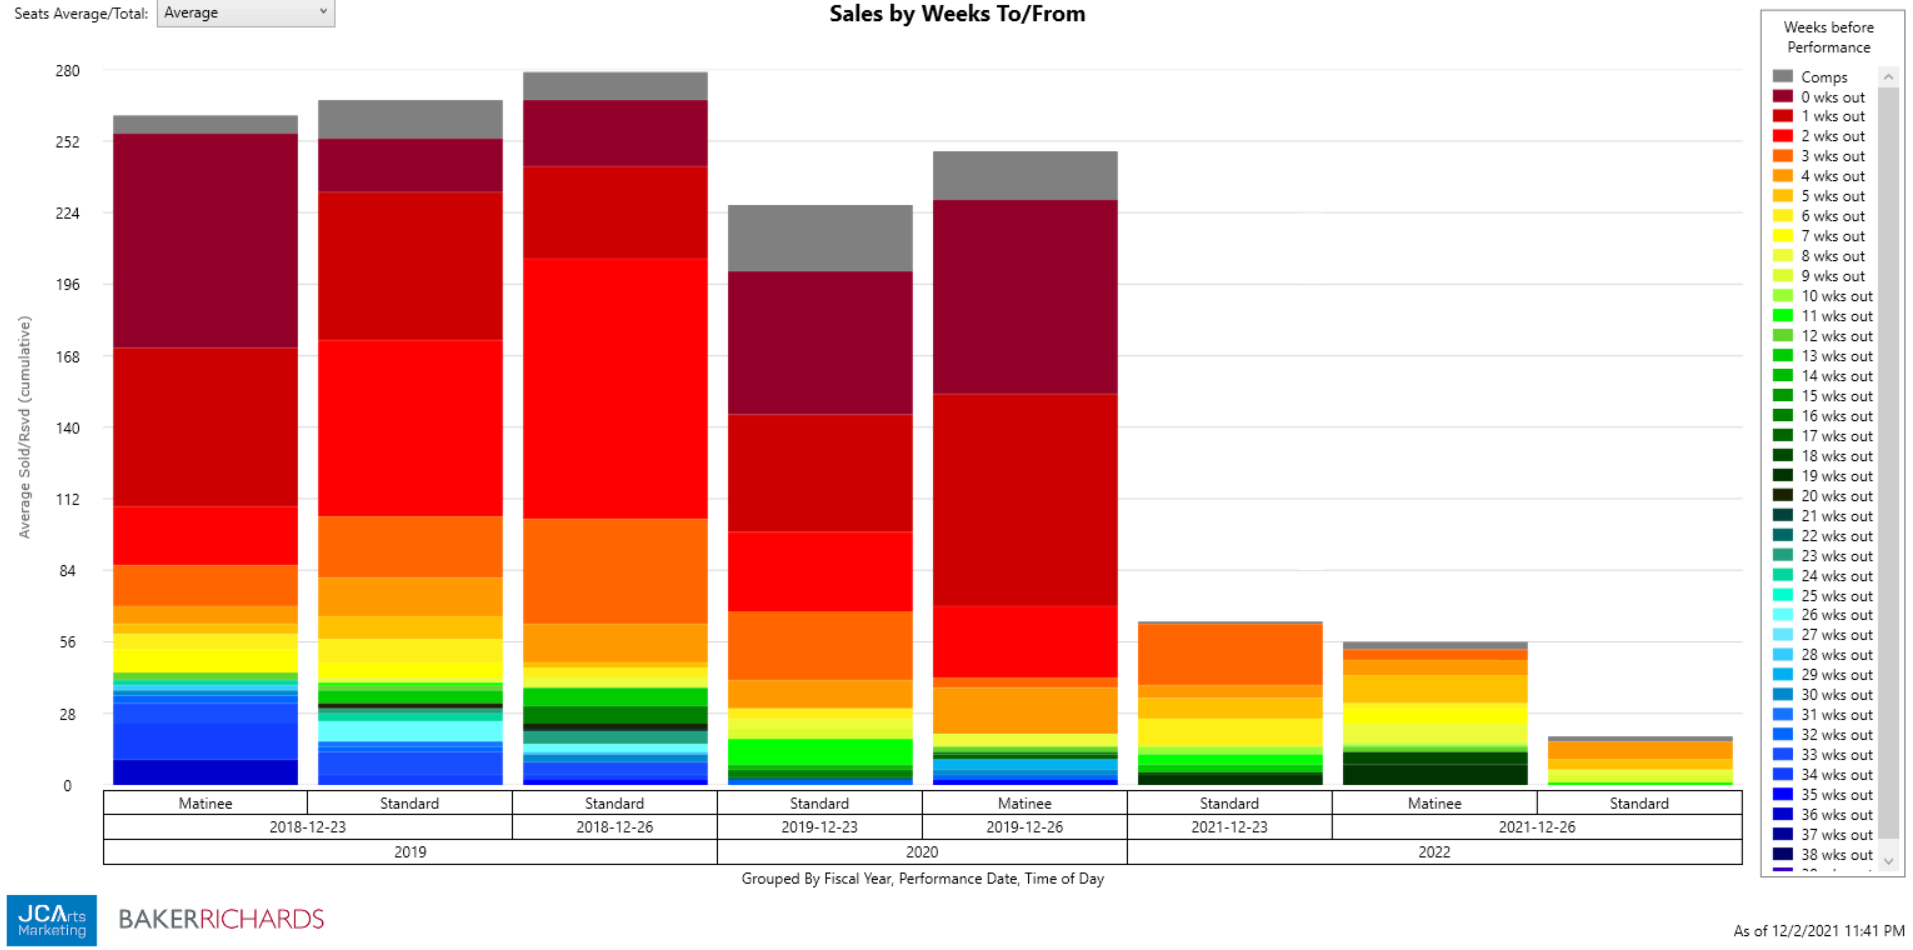
To read this chart, I’m going to look at the most recent color on my current year performances—in this case, dark orange, which represents sales 3 weeks out from the performance, and then compare it to the same color across the previous years. What I find is that, while I’m a little bit behind where my FY19 performances were, I’m right on track with, or even a little ahead of FY20. I can also see that the majority of sales for these performances typically happen in the last three weeks, so as long as I see sales pick up soon, there’s no need to panic.
It would also be great if I could group this chart a little differently—putting all of the 12/23 performances next to each other, and the 12/26 performances next to each other. This is a perfect use case for a custom grouping! You can create a custom performance grouping that groups all of the 12/23 performances together, all of the 12/24 performances together, all of the 12/31 performance together… etc. So that you can easily compare by date across years.
Average Sales by Price Type
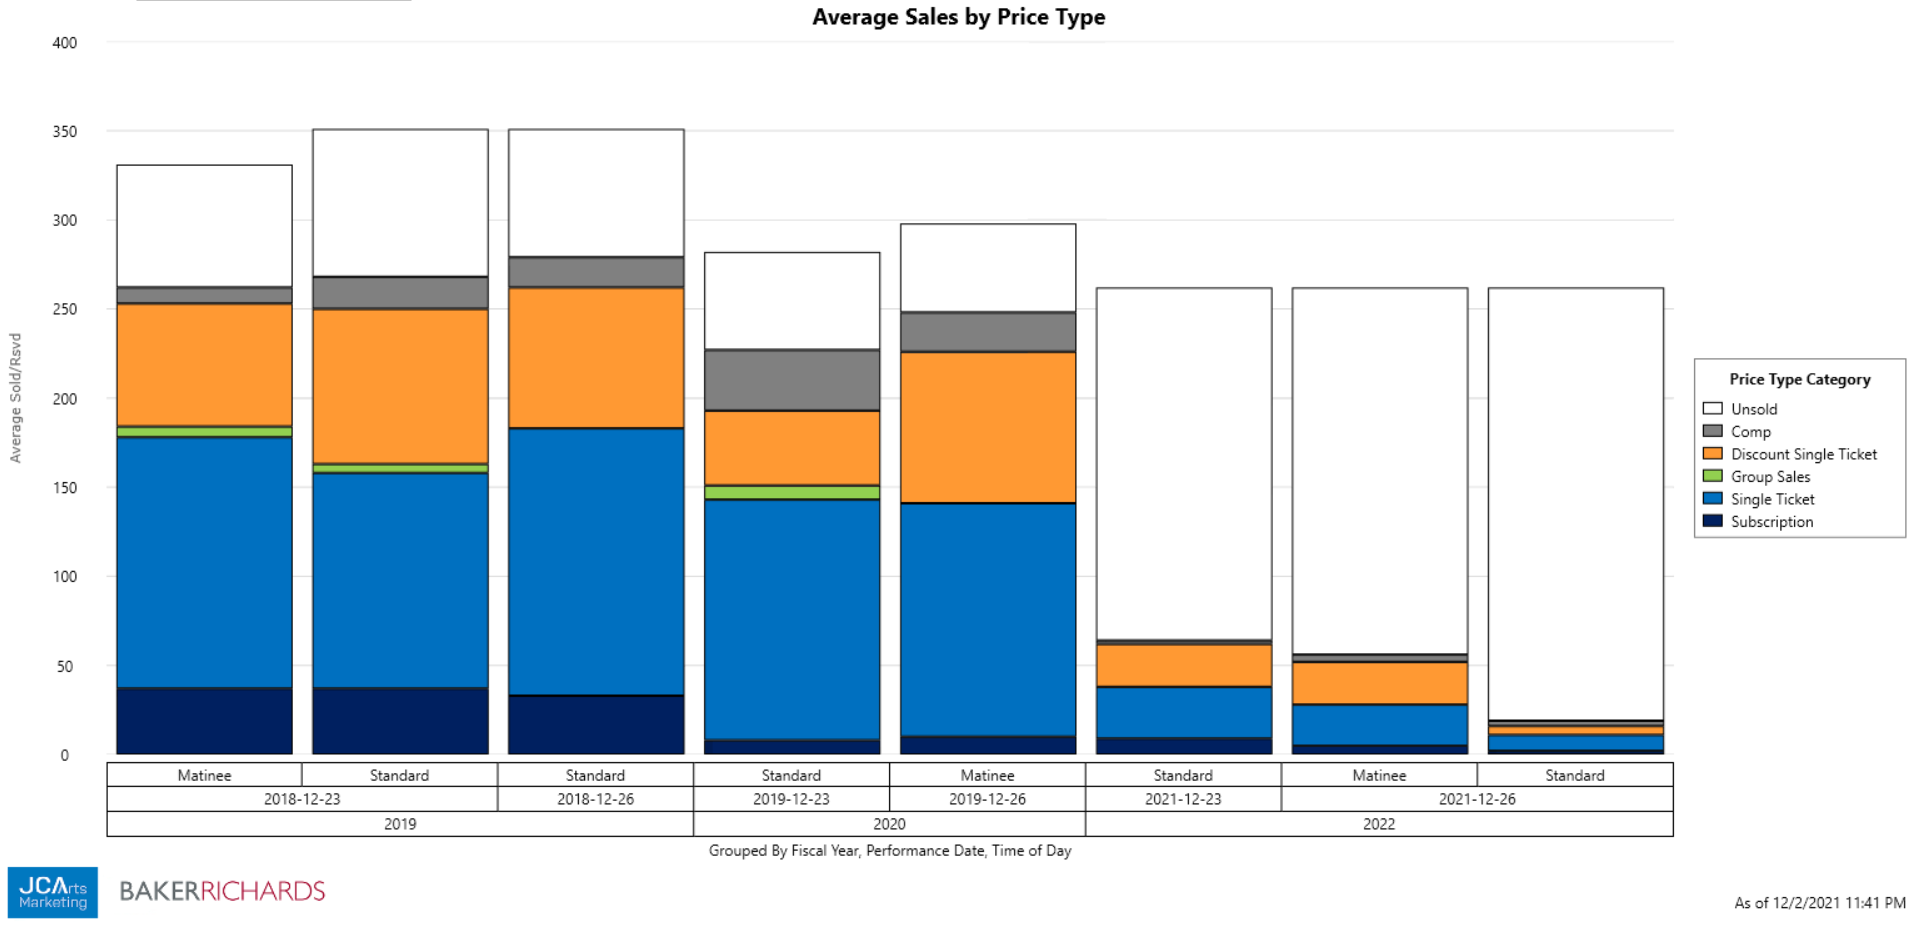
Another question that might arise, when seeing such a pattern of late buying, is whether the past performances on these dates were highly discounted, or packed with third-party tickets. So, that leads us to another report: Average Sales by Price Type.
I’ll use the same filters and groupings for this report as I did for the Sales by Weeks To/From report, with one additional grouping in the Y-axis for Price Type Category. If you really want to get detailed, you can group by Price Type instead of Price Type Category so that you can see exactly which discount price types were used in the past. But in this case, Price Type Category is sufficient detail for me to see that, while my past performances definitely had some discounting, the majority of tickets were sold at full price, so I don’t need to go out and send out a bunch of offers in order to match previous years.
I hope that these reports are helpful, and that this information serves as a reminder to always let data be your guide. With the RMA in your toolbox, you have quick and easy access to all the information you need to make informed decisions about pricing and keep your nerves under control. If you have any questions about any of the reports in the RMA, please reach out and we’ll be happy to help! Happy Holidays!