Your mission,<br>driven by data.<br><br>As a nonprofit-only consulting firm, we help organizations like yours leverage data and technology so you can do more, perform better, and dream bigger.
Vivian Advanced User Documentation
Vivian Advanced uses Artificial Intelligence (AI) to create seats and revenue forecasts and calculate the optimal single ticket price (dynamic pricing).
Machine Learning (ML) is applied to your historical data for both subscription and single ticket purchases. Similar events at your venue are grouped into clusters, and a tailored model is built for each cluster. These models reflect your organization’s event patterns, producing weekly forecasts that drive daily dynamic pricing recommendations, optimized down to the price point. The more data the ML sees, the smarter it gets. As the models gain more insights from your sales data, their recommendations become more accurate.
Ticket sales drive weekly forecast changes. Ticket prices influence forecasts only slightly, but they play a key role in price optimization. Each time you adjust prices, that new price becomes the baseline for the next day’s recommendations.
Business Impact
Enabling Vivian Advanced gives you access to the AI-generated forecasts for your upcoming productions. These forecasts are updated daily and closely track actual ticket sales, helping you make faster, more confident pricing decisions, without needing to manually select comparators.
Daily dynamic pricing recommendations by zone can guide manual price adjustments or be committed in just a few clicks, streamlining your workflow. By surfacing insights that were previously overlooked or time-consuming to manage manually, Vivian Advanced empowers you to act strategically, accelerating price changes and optimizing revenue potential.
Vivian Advanced Step-by-Step
Enabling AI Forecast
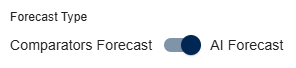
Vivian Advanced defaults to AI Forecast. You can choose between AI Forecast and Comparators Forecast. This choice will determine the values displayed in the Forecasting module and in the Monitoring Dashboard report.
- Select the “Forecasts” icon from the left-hand navigation.
- In the Forecast drawer, locate the Comparators Forecast / AI Forecast toggle to confirm AI Forecast is enabled. Click the toggle to switch between the Comparators and AI Forecast.
- Select your production or individual performance from the Forecasts table. Be sure to select your filters so the table displays.
AI Forecasted Sales Curve
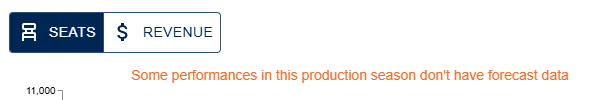
The Forecast drawer is designed to easily choose between Sales and Revenue curves.
1. Select the “Forecasts” icon from the left-hand navigation.
2. In the Forecast drawer, click on Seats or Revenue to change the curve displayed.
3. Select your production or individual performance from the Forecasts table. Be sure to select your filters so the table displays.
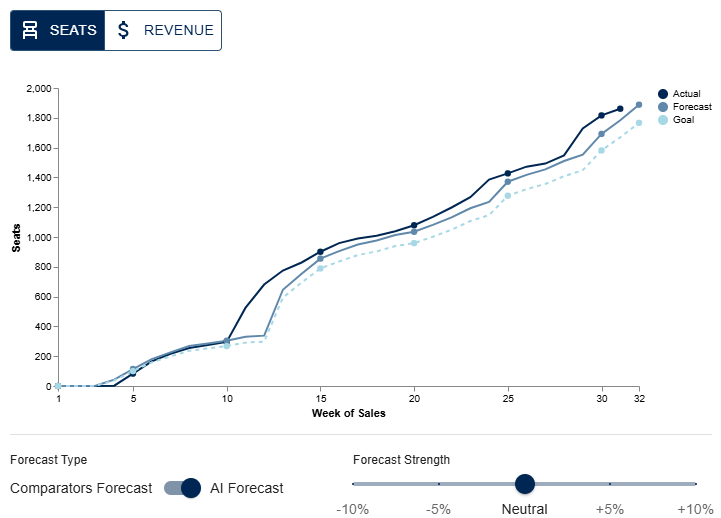
4. Optional: Click the Comparators Forecast / AI Forecast toggle to view Comparators Forecast.
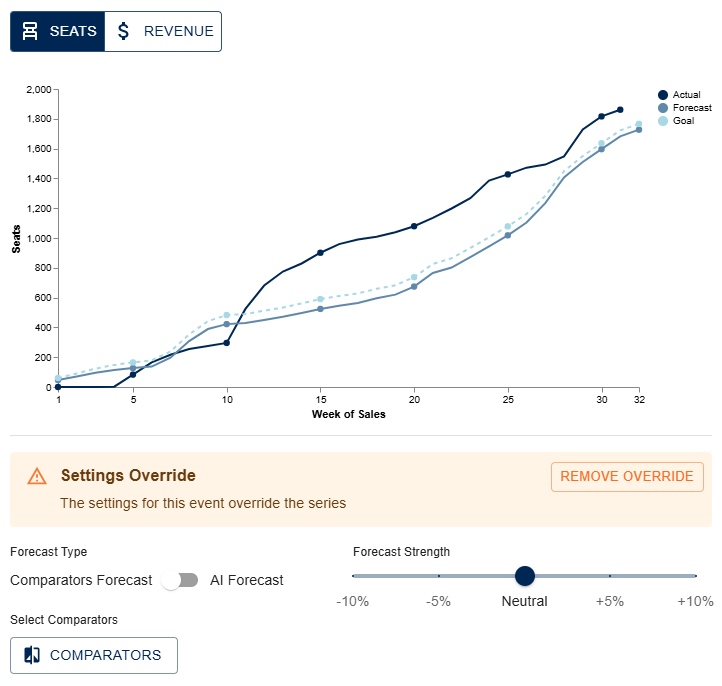
Forecast Strength
To manually adjust the forecast strength to be more or less aggressive, click on the slider that is defaulted to Neutral and drag it to -10%, -5%, +5% or +10%, based on how you want to adjust the forecast. The forecast curve will shift to the new numbers.

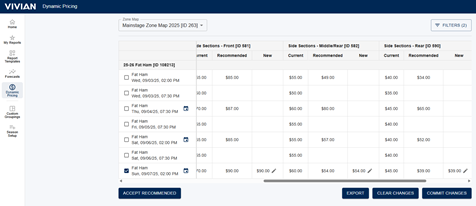
Daily Dynamic Pricing
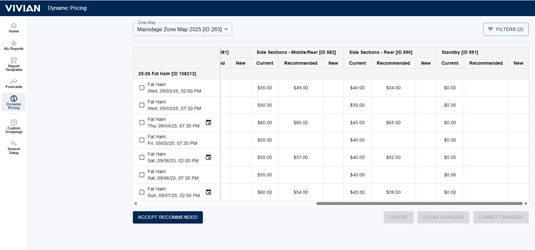
In Vivian Advanced, daily dynamic price recommendations are populated in the “Recommended” column of the dynamic pricing module. To review and apply your daily dynamic price recommendations:
- Select the “Dynamic Pricing” icon from the left-hand navigation.
- Choose a Zone Map from the drop-down menu if you have more than one. Be sure to select your filters so the table displays.
- Click on Accept Recommended.
- Review the prices in the New column for each zone.
- Click on the pencil icon to make manual edits to the prices. Delete the price to keep the current price.
- Commit the new pricing per the current flow.

Reviewing Dynamic Pricing Recommendations
Human oversight and decision-making is integrated into Vivian Advanced’s Dynamic Pricing workflow. When first using Vivian Advanced, review the price recommendations for all your zones by scrolling to the right. You can modify or delete any recommendations that aren’t aligned with your real-world understanding of your performances.
Support
The best way to reach our team for support with Vivian is to email us directly at viviansupport@jcainc.com. Please provide details on your support issue so we can plan a quick resolution.
FAQs
Q: What is Machine Learning?
A: Machine Learning is a subset of AI that enables systems to learn from data and improve their performance over time without being explicitly programmed. Using ML over other types of AI is often preferred when the goal is to learn from data and improve performance automatically.
Q: Why use Artificial Intelligence / Machine Learning to predict event forecasts and dynamic pricing?
A: Machine Learning is well-suited for forecasting and dynamic pricing because it can handle the complexity and scale of ticketing data more effectively than traditional statistical methods. Specifically, ML:
- Captures complex patterns in sales and audience behavior
- Processes large, diverse datasets efficiently
- Adapts to changing trends
- Supports feature engineering
- Enables near real-time forecasting and pricing recommendations
Q: What ML does Vivian use?
A: Vivian is using both unsupervised and supervised learning for the Vivian ML pipelines. Unsupervised learning is used to cluster events together, similar to the manual comparator selection process, but automated. Supervised learning is then used to produce forecasts for each of those clusters, based on knowledge of the previously sold events in each cluster.
Q: What data are used in Vivian Advanced?
A: More than 10 key event characteristics, including zone map, seat map, performance type, time of day, day of week, month of year, week of run, order (show) within the run, facility, capacity, and sales are used for Vivian Advanced AI. All analysis is based solely on your organization’s data—no outside sources are used—so recommendations reflect your venue’s unique patterns and audience behavior.
Q: What does the clustering of my performances look like?
A: Some clusters will have as few as two performances, meaning they are unique. The optimal number of clusters is between five and ten, but there can be a need for more clusters for many unique performances, and it’s expected that subscriptions and single tickets will have a different number of clusters.
Q: How do the models create my forecast curves?
A: The model predicts price points and aggregates them for subscriptions and single tickets.
Q: How are my daily price recommendations calculated?
A: Every night the Daily Update pipeline runs and any new events are then classified into the existing clusters. The price recommendations in Vivian get overwritten daily, so you see new fresh data based on your current performances. Vivian Advanced applies rules to limit extreme price changes, and any recommendation that exceeds the minimum or maximum thresholds is automatically adjusted to remain within those bounds.
Q: Why don’t some performances have forecast data?
A: Ensure you are looking at future performances, since forecasting is about what will happen in the future. Also, Vivian gets nightly updates of your data from Tessitura, and with all data management, regular work is required to ensure data quality and resolve expected data errors that could affect forecast or price recommendations.
Q: How do we know the ML models are making good predictions?
A: Models are evaluated through a combination of evaluation techniques, validation strategies, and interpretability tools. For Vivian Advanced, the forecast prototype models were evaluated using the mean-squared error (MSE) metric, which evaluated the type of model that would be best.