Landing Category: Hide from Search
Your Data Personality: The Data Strategist

Your Data Personality: The Data Strategist
Data Strategist, you’ve built an empire of insights and know how to leverage every piece of information to your advantage. Your unique perspective is your superpower. You’re skillfully weaving data into the fabric of your fundraising plans, making informed decisions that drive real results. Your data program is robust, likely encompassing a solid range of analytics and reporting. You’re constantly thinking three steps ahead, noting strategic trends, and acting on what others see as just numbers.
A bit of perfectionist (maybe…), you are meticulous, detail-oriented, and have a plan for everything. Your commitment to accuracy and depth ensures your data is not just collected but truly meaningful. At the same time, you know not to let perfection stand in the way of progress—you’re agile and ingenious, making the most of limited resources to keep moving forward.
What’s next and where do you need help? Great data management is a marathon, not a sprint—there’s always room to improve and refine. Keep evaluating your data quality regularly to maintain accuracy and usefulness, adapting as new challenges and curveballs come your way. Don’t hesitate to consider purging records that no longer add value—clean data is the foundation for clear insights and stronger decisions.
To become an absolute data icon and fundraiser BFF, explore predictive analytics to anticipate donor behavior, optimize your gift pipelines, and refine your stewardship efforts based on deep insights.
Remember, even the most brilliant data strategies and cutting-edge tools won’t reach their full potential unless the people around you are on board. Effective change management means communicating clearly, involving your team early, and providing the training and support they need to embrace new systems and processes. Bringing everyone along ensures smoother transitions and stronger, lasting success for your data program.
You’re already making great strides; now it’s about perfecting your strategic data advantage! Need a partner to help guide the way? – we’ve got you covered!
Ready to go to mega heights? Check out the resources below and talk with our JCA team!
Share this quiz with a colleague and compare your results!Your Data Personality: The Data Navigator
Your Data Personality: The Data Navigator
Oh, Data Navigator, you are the Gandalf of the operations team—you know the way, you understand the terrain, and you’ve seen the dangers lurking in the “shadows” of bad data. Your friends know they can count on you to guide them through any decision, whether it’s planning a big adventure or deciding what to order when everyone’s hungry.
Your ability to chart a course is a true asset. You’re actively using data to guide some of your fundraising decisions, and that’s a fantastic start. Your current data program likely covers essential metrics and some basic analysis with a few hiccups here and there. Your aura calmly quips “My reports are only as good as the data you put in the system.”
To really steer your efforts to the next level, prioritize solid data management and governance to ensure accuracy and trustworthiness. Dive deeper into donor behavior by effectively segmenting your audiences and identifying meaningful trends. Using well-governed, organized data to personalize your outreach will help you connect more authentically and drive better results. With these refinements in place, you’ll be charting even more successful fundraising courses.
A technology roadmap can serve as your own map of Middle-earth, a guiding chart that helps you navigate the twists and turns of your data journey. Just as the Fellowship relied on maps to find the safest and most effective paths, your roadmap keeps your team aligned, focused, and moving steadily toward your ultimate goals.
Bringing your team together and aligning your efforts will forge a powerful force for your fundraising quest. When everyone is on the same page—sharing insights, speaking the same data language, and pulling in the same direction—you’ll move forward with the strength and clarity of the Fellowship marching toward Mordor. Remember, even the smallest hobbit’s steps make a difference when taken together.
What’s next and where do you need help? Even though you’ve proven you are a capable leader, we’re here for you! Whether it’s charting your course for ongoing improvement, assisting with complex data transformations or aligning your teams around new processes or applications – we’ve got you covered!
Ready to embark on a fantastic data journey? Check out the resources below and talk with our JCA team!
Share this quiz with a colleague and compare your results!Your Data Personality: The Data Discoverer
Your Data Personality: The Data Discoverer
You, the Data Discoverer, are the super “true crime” podcast listener. You are always on the hunt for a hidden pattern, a missing link, or a piece of evidence that everyone else may have overlooked. You’re the master of spreadsheets, connecting the dots of a data set that seems “just a little bit sus.”
You’re just beginning to unearth the power of data in your fundraising efforts, and that’s exciting! Think of yourself as a Data Discoverer, with a vast landscape of potential yet to explore. And speaking of exploring, take a second for yourself to start researching that trip to Greece you’ve been dreaming about…you OWE it to yourself (we promise).
You are part of a bigger data ecosystem and your environment matters. Your current data program is likely in its foundational stages, focusing on basic record-keeping. You may be struggling to fully flex your data muscles because your legacy systems make working with data time consuming and highly manual (we are sorry!).
To elevate your impact, consider exploring how to track your most critical data points more systematically. Whether you’re already segmenting your audiences or just starting out, refining this approach—along with small steps like cleaning and organizing your data for better accuracy—can lead to more targeted communications. Small steps in data utilization can lead to significant gains in your fundraising outcomes!
If you’re thinking about replacing your CRM, take the time to assess your current data needs and how the new system can better support them. A thoughtful transition can improve data accuracy, streamline your processes, and empower your team to make more informed decisions. Remember, the goal is to find a tool that fits your unique requirements —not just the latest or most popular option.
What’s next and where do you need help? At this stage of your journey, we’re here for you! We can help you assess your current data landscape so you know exactly where to start and guide you through selecting the right system to fit your needs. Whether it’s strengthening your staffing to handle your day-to-day data deluge, supporting you with data clean-up services, or helping you document processes and procedures for better data management — we’ve got you covered.
Ready to discover more? Check out the resources below and talk with our JCA team!
Share this quiz with a colleague and compare your results!Your Data Personality: The Data Maestro
Your Data Personality: The Data Maestro
You are THE data enthusiast, the hype person. You’re not just working with data; you’re building elaborate, mind-bending projects that captivate everyone’s attention. You turn a simple report into a spectacle, a dashboard into an event. You’re all about the big picture and the even bigger reveal. Bravo, Data Maestro! You are truly orchestrating fundraising success through the sophisticated use of data.
Your data program is not just effective; it’s a finely tuned instrument, providing comprehensive insights that empower you to optimize every aspect of your fundraising. From donor segmentation to campaign performance, your creative energy brings data to life in ways that inspire action and drive results.
Your creative energy is unmatched. It’s time to channel that star power into leading something truly epic and revolutionary for your organization. To maintain your maestro status, continue to innovate by exploring advanced analytics, innovative system efficiencies, and AI Tools.
Artificial Intelligence is your next powerful instrument in the data orchestra. Use AI tools to uncover hidden donor patterns, automate routine tasks like data cleaning and segmentation, and generate predictive insights that help you anticipate giving trends and personalize outreach with laser focus. Explore AI-driven chatbots to engage supporters and apply machine learning to optimize campaign timing. As you experiment, stay mindful of ethical considerations by ensuring transparency, respecting donor privacy, and promoting fairness—building trust and long-term relationships along the way.
To support and elevate your data program, consider exploring graph databases and semantic tools. Graph databases allow you to map and analyze complex relationships between donors, campaigns, and other key data points, unlocking insights that traditional databases might miss. Semantic tools help add context and meaning to your data, making it easier to connect disparate information and generate smarter, more nuanced analytics. Together, these technologies can deepen your understanding and help you tell richer, more impactful fundraising stories.
Remember, even the most brilliant data strategies and cutting-edge tools won’t reach their full potential unless the people around you are on board. Effective change management means communicating clearly, involving your team early, and providing the training and support they need to embrace new systems and processes. Bringing everyone along ensures smoother transitions and stronger, lasting success for your data program.
In short, keep leading the way in data-driven fundraising! The future of fundraising is bright with you at the helm.
What’s next and where do you need help? Whether it’s exploring advanced data storage and reporting solutions, providing extra hands-on support to make your data dreams come alive, guiding effective project and change management, or serving as your trusted thought partner as you embark into uncharted territories – we’ve got you covered!
Check out the resources below and talk with our JCA team!
Share this quiz with a colleague and compare your results!Vivian Feature Focus: Forecasting

Vivian Feature Focus: Forecasting
Today, we want to highlight a new feature in Vivian that we are super excited to see come to life in our clients’ environments—Forecasting!
For those of you who were familiar with the Forecasting Module the RMA, you remember the time investment required to assemble your comparators and create a forecast for an upcoming production. It was a bit of a tedious process! Well, no more with Vivian. In Vivian, you can forecast ticket sales and revenue for both single tickets and subscriptions for a full production season with just a few clicks.
Here is the step-by-step process—with some pro tips—for setting up forecasts in Vivian using the “Comparator Forecast” setting (the “AI Forecast” setting will be coming soon in Vivian Advanced! For now, we’ll focus on Manual forecasts).
1. Pick the production season you want to forecast.
Go to “Season Setup,” click on “Filters” in the upper right-hand corner of the screen. In the slider that pops out, click on “Add Filter,” select “Production Season,” select the production season you want to forecast, click on “apply filters.”
2. Select your Comparators.
Back on the main “Season Setup” screen you’ll now see the production season you selected (in bold) and all its performances. Now it’s time to select the comparators whose sales data you want to use to create a forecast for your production season.
Click on the bolded line for the production season. This will bring you to a Comparators screen. To find comparators and add them to the “Comparator Finder,” click on “filters” and then click on “Add filter” to add the comparators you want to consider. You may add individual production seasons or full seasons. Next, select the seasons or production seasons you want to review, and click “Apply filters.”
Your potential comparators will then show up like this:
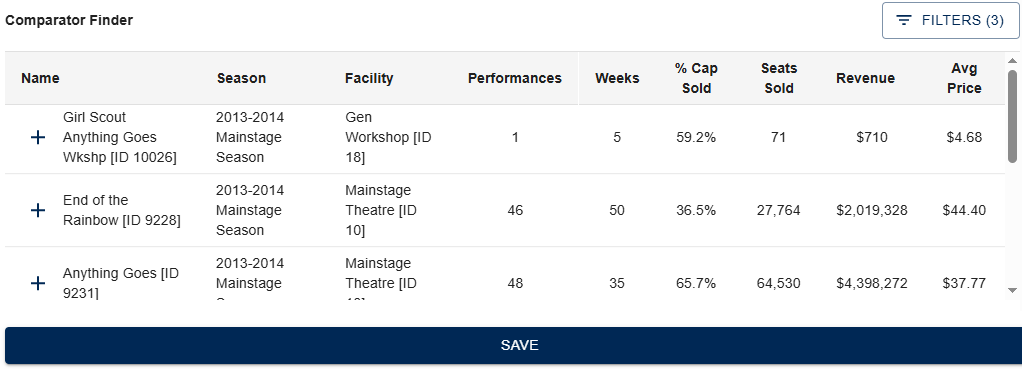
You can use this comparator finder to find shows that performed similarly to how you expect your performance, in this case La Traviata, to perform. You might look for shows that are in the same facility, have a similar number of performances, and have a similar average yield. In the case above I might throw out Sweeney Todd because the Average Price was too low and may sway my forecast, and I’ll also throw out Lydia because it was in a different theatre with a longer run.
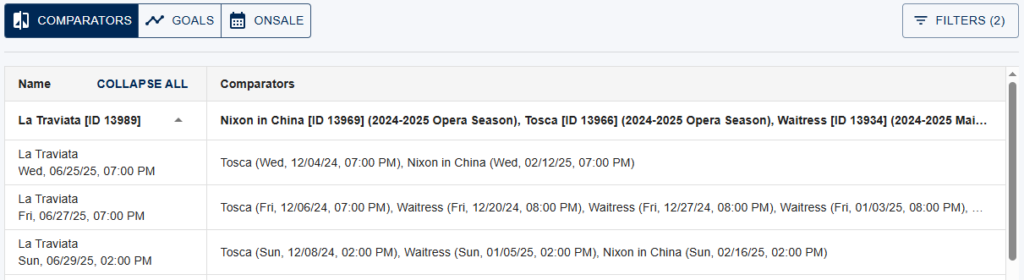
You can add comparators to the “Selected Comparators” below (or the comparators you want to use for your forecast) by clicking on the cross to the left of each production season. Once you’re set with your comparators, click “Save.” Vivian will automatically match each of the performances in your comparators to the performances you are forecasting for by Day of Week and Performance Type:
3. Set your Goals.
Now it’s time to set the goals for your ticket sales and revenue for the production season. Remember, your goals are different from your forecast. Your goals are the target numbers that you are aiming to reach with your marketing strategy to meet institutional expectations. Your forecast is where your ticket sales and revenue are likely to end up based on similar historical performances (or, comparators, as we’ve referenced here). Your forecast should, ultimately, inform your goal.
To set your goals, click on the “Goals” button at the top of the page (we’re still in the “Season Setup” screen.) You’ll see existing revenue and seat goals for sub and single tickets. If you use the “budget” line in Tessitura to enter your performance goals, that number will be reflected in the “revenue” numbers. To adjust the goals, click on the bolded production season line. You can then select one of three options in the radio dials:
- Proportionally matching the forecast: If you select this, your goals will match the forecast set with your comparators. So, if a Friday night performance is forecast to sell more tickets than a Wednesday matinee, the Friday night performance will receive a proportionally larger share of the budget than the Wednesday matinee.
- Proportionally matching the current goals: With this selection, Vivian will update any existing goals for each performance so the relationship between each performance’s goals remains the same.
- Equally across events: This selection will give each performance the same goal.
Once you’ve selected the option you prefer, enter the total revenue and seat goals for both subs and single tickets and click “Save Goals.”
4. Review your forecasted sales curve.
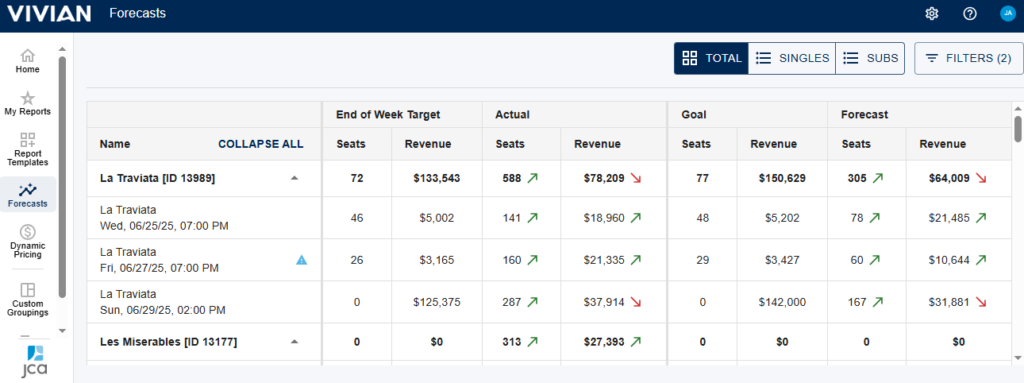
Now that you have set your comparators and your goals, let’s go to the “Forecasts” icon in the left-hand navigation. You’ll see, on the right side of the table, your set goals and your forecast—for both the production season in bold and each individual performance (if you don’t see the Production Season in question, you may need to update your filters!). On the left side of the table you’ll see the “End of Week” target— which shows you, using the shape of your forecast as a guide, where you should be at the end of the week to reach your goal—and your actual sales. The arrows indicate if you are trending above or below your goals.
To see your forecasted sales curve for the Production Season, click anywhere on the bolded line at the top. A slider will pop out which will show you a sales curve that includes your actual sales, your forecasted sales, and the sales curve for your goal.
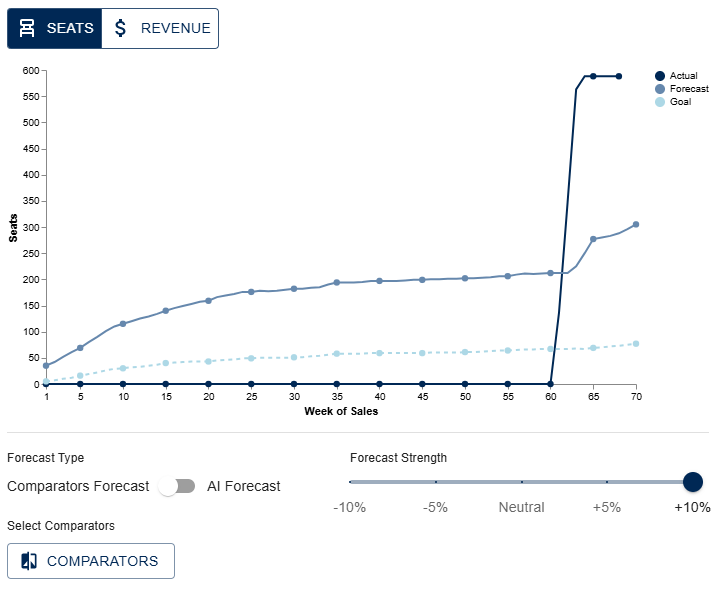
You’ll notice here that you are able to adjust your forecast strength as well. If you want the forecast to be more aggressive, for example, you can increase it by 5% or 10%. If you want to be less aggressive, you can decrease it by 5% or 10%.
At this point you are done creating your forecast! Congratulations! It’s that easy with Vivian, giving you more time to engage with show attendees.
Now let’s see how you can use that forecast in Vivian.
5. Use your forecast in the Monitoring Dashboard.
On your Monitoring Dashboard for the Production Season you just forecasted, you can include a widget to show where your sales are for each performance relative to its forecast and goal.
You can find the Monitoring Dashboard under Report Templates on the left-hand navigation, under “Daily Tracking Reports.” When you create your Monitoring Dashboard, you can go to “View” at the top of the screen and select the “Measures” drop-down to select the measures that use the forecasting data. Those measures are selected in the image below (there are also the same measures for Subscriptions if you scroll down further):
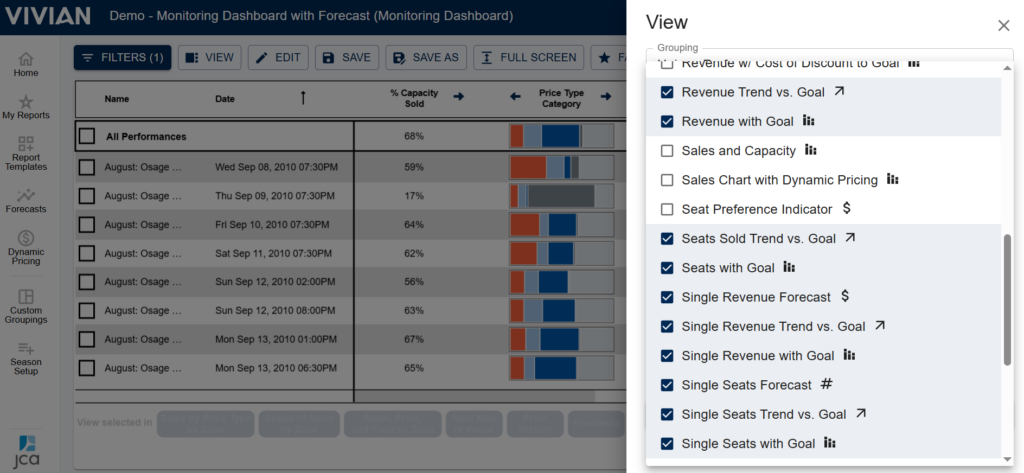
We selected the measures that relate to forecasting and goals for single tickets to add to our Monitoring Dashboard for La Traviata, which look like this:
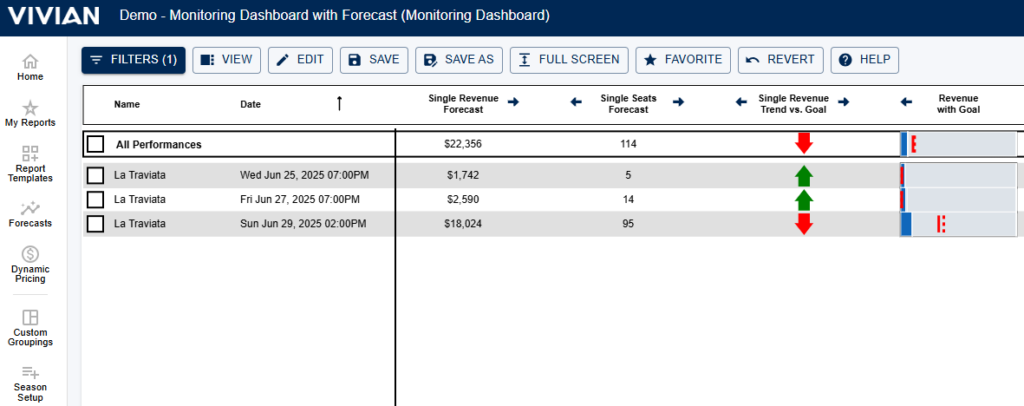
Here is how to interpret these widgets (the widgets featured in the image above and in the details below above are for single tickets, though the related widgets for total revenue and subscription revenue operate the same way):
- Single Revenue Forecast: This is the single ticket revenue the forecast projects the show will bring in.
- Single Seats Forecast: This is the number of single tickets sold that the forecast projects the show will bring in.
- Single Revenue Trend vs. Goal: The arrow shows if your actual revenue is above or below your forecasted revenue trend.
- Single Revenue with Goal: The Blue bar is your actual revenue. The solid red line is your revenue target for this week to meet your goal. The dotted red line is your goal.
There are also “Seats” version of the last two widgets listed above which can be interpreted similarly, but refer to seats rather than revenue. Use these widgets in the dashboard for a quick view of how each performance is performing against its goal.
6. Use your forecast in Dynamic Pricing.
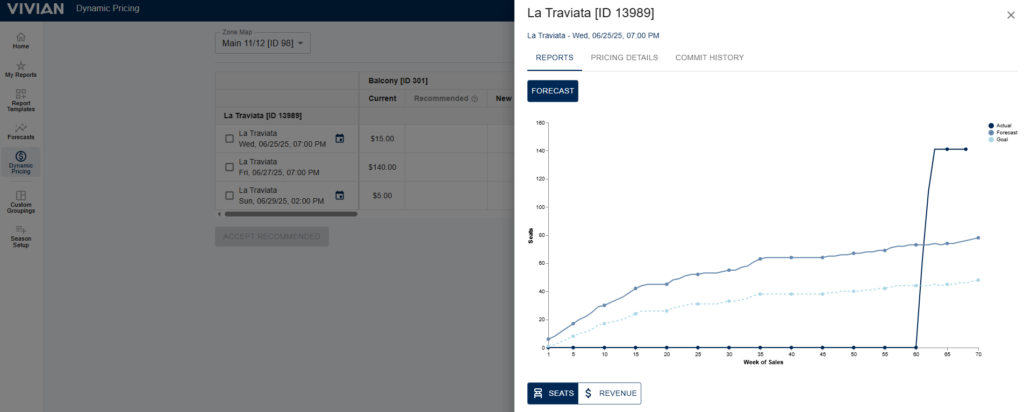
In the Dynamic Pricing module (which you’ll access on the left-hand navigation of your screen), you can also use your forecast for a quick reference as to how each production is performing as you’re making dynamic pricing decisions. Here’s how:
Once you’re in the Dynamic Pricing screen, select a production you have already created a forecast for under “Filter.” Once the screen populates, you can click on the r the individual performances and a slider will pop out on the right-hand of the screen that shows you the forecast for that production season or performance. You can use that as quick reference as you make dynamic pricing decisions!
That’s it! You now have a forecast you can use in several areas of Vivian to advance your revenue management strategy. If you have any questions about creating forecasts, let us know! Contact us at viviansupport@jcainc.com.
In Vivian Advanced, creating forecasts will be even easier. Scheduled to go live soon, Vivian Advanced has an “Auto” forecast option which will use machine learning to create a forecast for your shows in Tessitura automatically—no manual entry on comparators required! We’ll share another Feature Focus article on Auto Forecasts as soon as Vivian Advanced is released.
RE 7 Sunset in 2027: Is RE NXT the Right Next Step for Your Organization?

RE 7 Sunset in 2027: Is RE NXT the Right Next Step for Your Organization?
For several years, Blackbaud has teased a sunset of the self-hosted Raiser’s Edge 7 (RE 7) product. According to the latest product update on May 6th, that sunset date will be sometime in the first half of 2027. Many organizations that have been hesitant to move from their RE 7 systems now feel the pressure to consider alternatives.
It’s safe to say that any organization still using RE 7 needs to begin planning for change. While we always recommend that you understand your needs and explore your options before making a big purchase decision, migrating to Raiser’s Edge NXT (RE NXT) is an obvious alternative. While some major milestones remain, Blackbaud has been moving quickly to expand functionality in its web view interface with the goal of fully retiring the RE 7 database view.
If you are thinking about moving to RE NXT, here are five things your team may want to consider.
Timeline and Budget
Implementing RE NXT may be a lighter lift than a move to another system
A short timeline and minimal costs for migration provide a strong rationale for migrating to RE NXT versus an alternate system. Implementing a brand-new system could cost six figures for a mid-size organization. There’s also the risk of data loss in a conversion and additional time and resources spent to support new system design, replication of reporting, testing, and training. In comparison, an RE NXT migration from RE 7 requires minimal effort from the organization and the timeline can be as little as 2 months from start to finish.
Organizations who want to optimize their RE NXT systems rapidly should consider a timeline that includes ample time for training, integration setup and testing, and business process review and redesign. This may take 4-6 months, which is still significantly shorter than a typical 12+ month new system implementation timeline.
While the migration itself doesn’t require significant budget resources, organizations should still consider budgeting for consulting help to assist with a transition. This might involve investing in change management (it can be hard for people to let go of the database view!), getting customized training, supporting teams as they redesign workflows to optimize new web view tools, or assisting with report and integration development.
Additionally, ongoing subscription costs should be considered and may increase annual operating budgets. For organizations who have self-hosted, paying maintenance charges only, there will typically be an increase in annual subscription fees.
System Usability
Both Web View and Database View are available in RE NXT
For now, RE NXT is a dual access application. There’s the new web view, which has streamlined views and functionality, along with the database view, which requires a Citrix application to access.
On the positive side, savvy database users will still find many of the views, screens, and operations they’re used to when using the database view. Front-line fundraisers will appreciate new tools in web view that improve workflows like the Work Center, Lists, Mapping, and configurable constituent views. On the downside, infrequent users will need to adjust to a whole new interface and way of viewing, searching, and working with records.
This dual access nature of RE NXT can sometimes be confusing as some users will be more comfortable with one view or the other. Also, the functionality isn’t necessarily congruent from database view to web view, which presents another learning curve. Organization-specific documentation and procedures like membership management, for example, often need to reference how to perform functions using both sets of tools.
With Blackbaud moving all functionality to the web view, this could be considered a short-term challenge. Teams that are resistant to change and learning new skills may find this frustrating. A team that is eager to embrace improved tools and is comfortable adapting to a system that’s evolving rapidly will find the changes to be exciting rather than daunting.
Integrations Strategy
RE NXT has enhanced integrations and automations
An advantage of an RE 7 to RE NXT move is the opportunity to leverage a growing list of pre-built integrations that extend and enhance RE NXT functionality. Additionally, Blackbaud is still working to create API endpoints for all its areas, but there are already a good number of APIs to use for integration needs.
Additionally, many RE 7 users rely on queue processes to download and deliver data for external systems. Be reassured that queue processes will still work after a migration, but their delivery destinations will need to be updated. For those looking for additional automation around data extracts and delivery, RE NXT users can leverage Power Automate to build flows that create CSV files from queries on a set schedule.
For those with some technical savvy, the Power Platform from Microsoft can open many opportunities for system customization and process automation. As a caution, fully leveraging Power Platform requires a premium Microsoft license and a good deal of training to build and maintain any customizations.
Data Access
RE NXT’s expanded APIs mean easier access to data
Some organizations have hesitated to make the migration to RE NXT because they know they will lose direct access to their data as Blackbaud requires that you commit to their cloud hosting as part of the package. You may be running custom SQL scripts on your data to produce reports or copying your data over to a data warehouse for reporting and analysis. The thought of losing that control over your data may feel like a reason to delay a move.
The good news is that there are tools available that help RE NXT users regain some of that data access while freeing them from the responsibility of maintaining the system itself. The expansion of RE NXT’s APIs means it is easier to extract data, transform data and then re-import it to the system. There are also tools available that replicate the data for use in a data warehouse or other external program.
It’s safe to say that options are continuing to grow as Blackbaud adds additional web functionality to the platform.
Business Intelligence and AI Tools
Access to new reporting and AI tools for after migration
First, let’s talk AI! Blackbaud has integrated several AI tools into RE NXT aimed at making our work as fundraisers easier. These tools help generate donor specific content and highlight prospects for action and review. And there is more in the works. As RE NXT’s AI tools develop, there will be no hunting around in different places to understand your donors. Blackbaud Co-Pilot will provide you with summaries and act like your personal assistant, answering questions and elevating insights.
Reporting continues to be a work in progress in RE NXT. Recently, Blackbaud released most of the standard RE 7 reports into the web view, which gave a sigh of relief to long-time users. For those still on RE 7, it’s common to rely on tools like Crystal Reports to create customized reporting that meets specific needs. Blackbaud discontinued its support for Crystal Reports with RE NXT, so this isn’t an option after migration. While you can still access some old Crystal Reports, you are unable to create new reports or edit existing reports once your migration is complete.
For those that have come to rely on their Crystal Reports, there are other solutions for reporting that can be considered.
- The RE NXT List functionality can replace commonly used reports and RE 7 user dashboards like a recent gift report, portfolio assignment list, or recent/upcoming actions report.
- The Good: Lists are so much more user friendly than queries and can accomplish a lot of needs.
- The Bad: Lists are often missing output fields that users want to see. They also don’t include the ability to filter/show all data areas (e.g. Action attributes), but this is coming.
- For real-time data on Campaign, Fund, Appeal, and Opportunity performance, RE NXT has pre-built dashboards and insights that provide summary data tied to these record areas. The dashboards include the ability to filter by specific records, dates, and categories.
- The Good: This data is easy to access and view. It is also easy to fly out a detailed list of constituents or gifts when you’d like to see the detail behind the summary.
- The Bad: RE NXT relies on two lenses for all its reporting (Gifts committed/Gifts received). These lenses allow you to group gift types into a category for a view, but you can’t filter reports or group revenue by specific gift types. You have to rely on the standard reports to get these views on revenue.
Producing more customized reporting that addresses specific business needs usually requires the use of a business intelligence solution like PowerBI or Tableau which can produce reporting using data extracted from RE NXT.
If your organization likes its reports to tell a specific story in a specific format, then it would be wise to plan on integrating a more advanced reporting tool into your RE NXT system.
Time to take the plunge!
While the transition from RE 7 to RE NXT comes with its challenges, it also offers meaningful opportunities to modernize your tools, streamline processes, and position your organization for future growth. By understanding the usability changes, realistic timelines, integration options, data access strategies, and reporting tools available, your team can approach this migration with confidence.
The key is thoughtful planning—taking time to map out your priorities, train your team, and build the right support systems around the new platform. Whether you migrate this year or next, having a clear plan in place will help you make the most of what RE NXT has to offer.
We’re here to help!
JCA’s expert consultants are seasoned RE 7 and RE NXT users and have considerable experience in helping organizations make the move—and be better for it. Let us help you plan your conversion, prepare your team, and make sure your processes in the new system set you up for success.
Let’s Talk!Download: RE 7 Sunset in 2027—Is RE NXT the Right Next Step for Your Organization?
Download: RE 7 Sunset in 2027—Is RE NXT the Right Next Step for Your Organization?
RE 7’s days are numbered. Is your organization ready for a transition to RE NXT? Before you make the jump, read about five crucial factors that could make or break your migration. Don’t go in blind—read our guide now and plan your transition with clarity and confidence. A copy of the guide will also be sent to your inbox.
Trends in Audience Behavior: Elections, Shadow Audiences & Hidden Treasures
Thank you for requesting our study, “Trends in Audience Behavior: Elections, Shadow Audiences & Hidden Treasures
Please check your email for access, or read the study by clicking on the button below.