RMA Feature Focus: Sales Curve


Jennifer Nemeth
Manager, Professional Services
It’s been two years since most organizations have launched a new in-person season, so for this RMA Feature Focus, we wanted to go back to the basics and review best practices for one of the most heavily used reports in the RMA: the Sales Curve.
The Sales Curve report is most commonly used to measure the speed of sales for upcoming performances against past comparator performances. If you’ve been copying the same sales curve over and over, without adjusting any settings; now is a great time to re-visit all of your options to make your sales curves work for you!
Below are a few scenarios you might want to track using a sales curve, and how we recommend configuring your settings to get the best information out!
Scenario 1: Tracking Subscription Sales
A Sales Curve can be a great tool for tracking the speed of subscription sales year-over-year. This year in particular, it will be helpful to understand whether your subscriptions sales are trending ahead or behind “usual” so that you can adjust your strategies accordingly. Here’s how we would set it up.
Measure: Total Sold/Reserved
Why: You’ll want to see all of the subscription tickets sold. In this case, an average by performance is not going to be very meaningful. Keep in mind that the RMA does not track packages, it tracks tickets, so the numbers will be larger than other reports you might use to track packages.
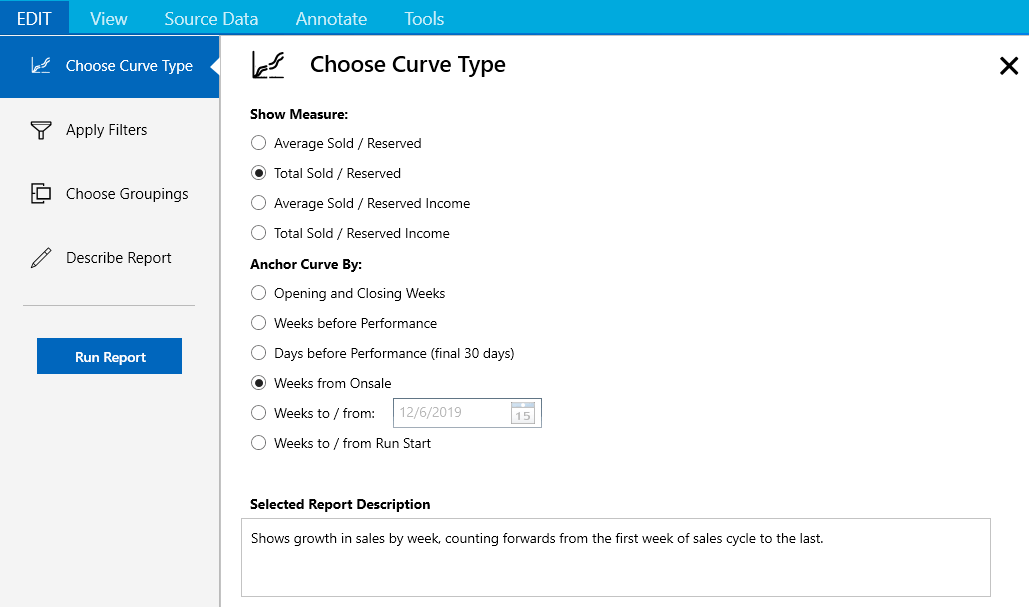
Anchor Curve By: Weeks from Onsale
Why: Using the Weeks from Onsale anchor will allow you to compare subscription sales for the upcoming season to the same point in the sales cycle for previous seasons. Remember — the RMA is using order date to determine time of sale, so if you make exchanges in another order throughout the season, subscription tickets may shift to later dates as they’re exchanged.
Filters: Filter by Season and Price Type Category
Filter for all of the subscription performances in the current season, as well as the last 2-3 complete seasons. This means you’ll likely be comparing 2021-22 against 2018-19, 2017-18, and maybe even 2016-17. Also make sure to add a filter for Price Type Category: Subscription.
Why: Since many of the tickets in the 2019-20 season were likely returned, they’re no longer going to show up on your sales curve, so 2019-20 isn’t going to be a great comparison, and you’ll need to go back farther. You’ll filter by price type category so that you can see only the subscription tickets on this curve, even after single tickets go on sale. If you want to include subscriber add-on tickets and they’re not in the Subscription Price Type Category, you can either filter at a more granular level by Price Type, or create a custom price type grouping!
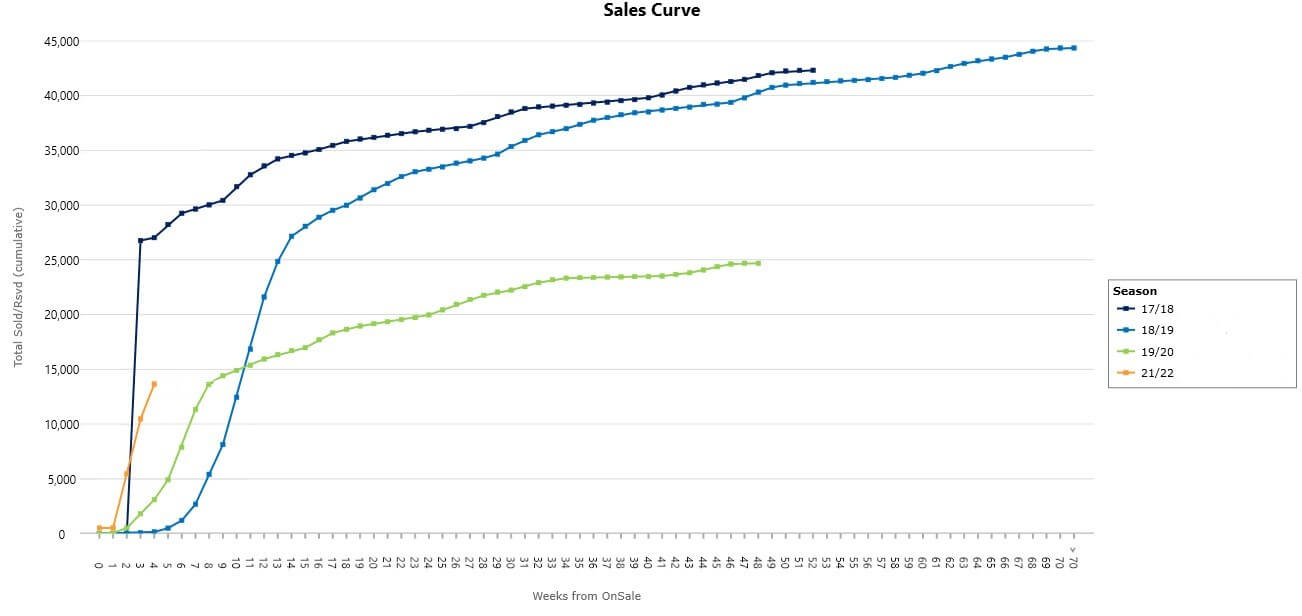
Groupings: Group on the y-axis by season, so that you get a single line for each season that you’re comparing.
Result: The result should be a sales curve that allows you to compare current subscription sales against past seasons.
We’re hearing from many clients that subscription sales are strong, and are trending ahead of past years. If that’s the case for your organization (or even if it isn’t), we’d love to hear about it!
Scenario 2: Tracking an Upcoming Performance That Has a Goal to Sell Out
When you’re tracking a performance that is expected (or hoped) to sell out, a sales curve provides an easy way to track that progress. Here’s how we’d set it up.
Measure: Average Sold/Reserved
Why: If the goal is a sell-out, then tracking the number of tickets is going to be easier than tracking income. We’re going with average, in this case, because it will allow us to compare past titles even if they had a different number of performances from the upcoming title.
Anchor Curve By: Weeks before Performance
Why: In this case, the key date is the performance date. We know we need to sell out before we reach the performance, so viewing sales as a count-down to that date will help us see how far we need to go and how much time we have to get there.
Filters: Filter by Production, Production Season, Title, and/or Unique Performance
We want to use our filters on this report to search for specific performances in the past that sold out. We also want to look for performances that had a similar length of sales cycle, and/or were at a similar time of year.
Why: Using performances with a similar sales cycle will make it easier to compare where you stand now and how far you have to go.
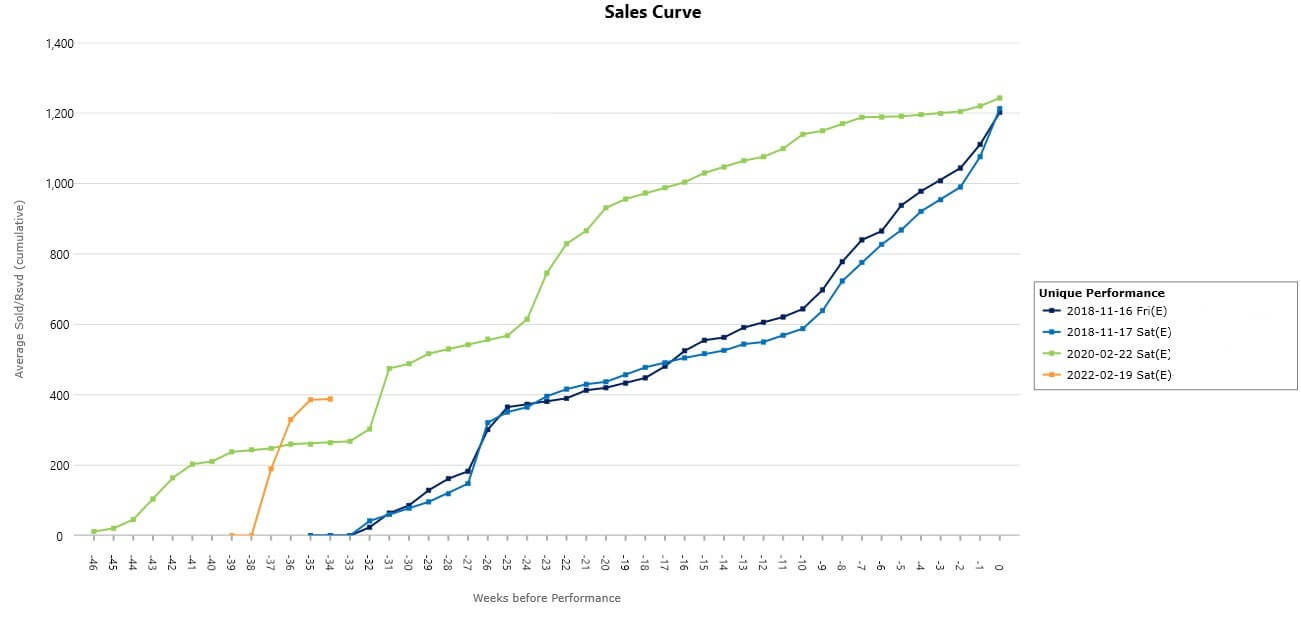
Groupings: Group on the y-axis by Production Season (or Production, Title, or Unique Performance) and Season
Why: The first grouping should help you see an easily readable version of whatever the performance title is. Grouping by Season will help you understand the context for past performances. If you’re comparing against a performance that was 15 years ago, you want to know that, and probably not put quite as much weight on such an old comparator.
Result: The result of this sales curve will be a visual for how your performance is tracking compared to past sell-outs, and give you a reference point for whether you’re on track, pacing ahead, or lagging behind.
Scenario 3: Tracking Single Ticket Sales for an Upcoming Production Run
If your organization produces or presents performances over more than one weekend at a time, you’ll likely need to track total sales over the course of the entire run, and a sales curve is a great place to do that! Here’s how we’d set it up.
Measure: Total Sold/Reserved Income
Why: You probably have an income goal for the whole production, so this time, we want to view the total income that all of these performances are bringing in combined.
Anchor Curve By: Weeks to/from Run Start
Why: When you’re working with longer productions (anything longer than one weekend), the Weeks to/from Run Start is an ideal anchor for tracking sales. This anchor sets zero at the first performance date, and then lets you compare sales leading up to the start of the run as well as during the run.
Filters: Filter by Production Season; Performance Type
Why: Depending on your Tessitura setup, you want to use filters that allow you to choose multiple Productions from past and upcoming seasons. Usually, Production Season is the best option. You may also need a Performance Type filter to filter out things like dress rehearsals or other performance types that are not “typical” performances.
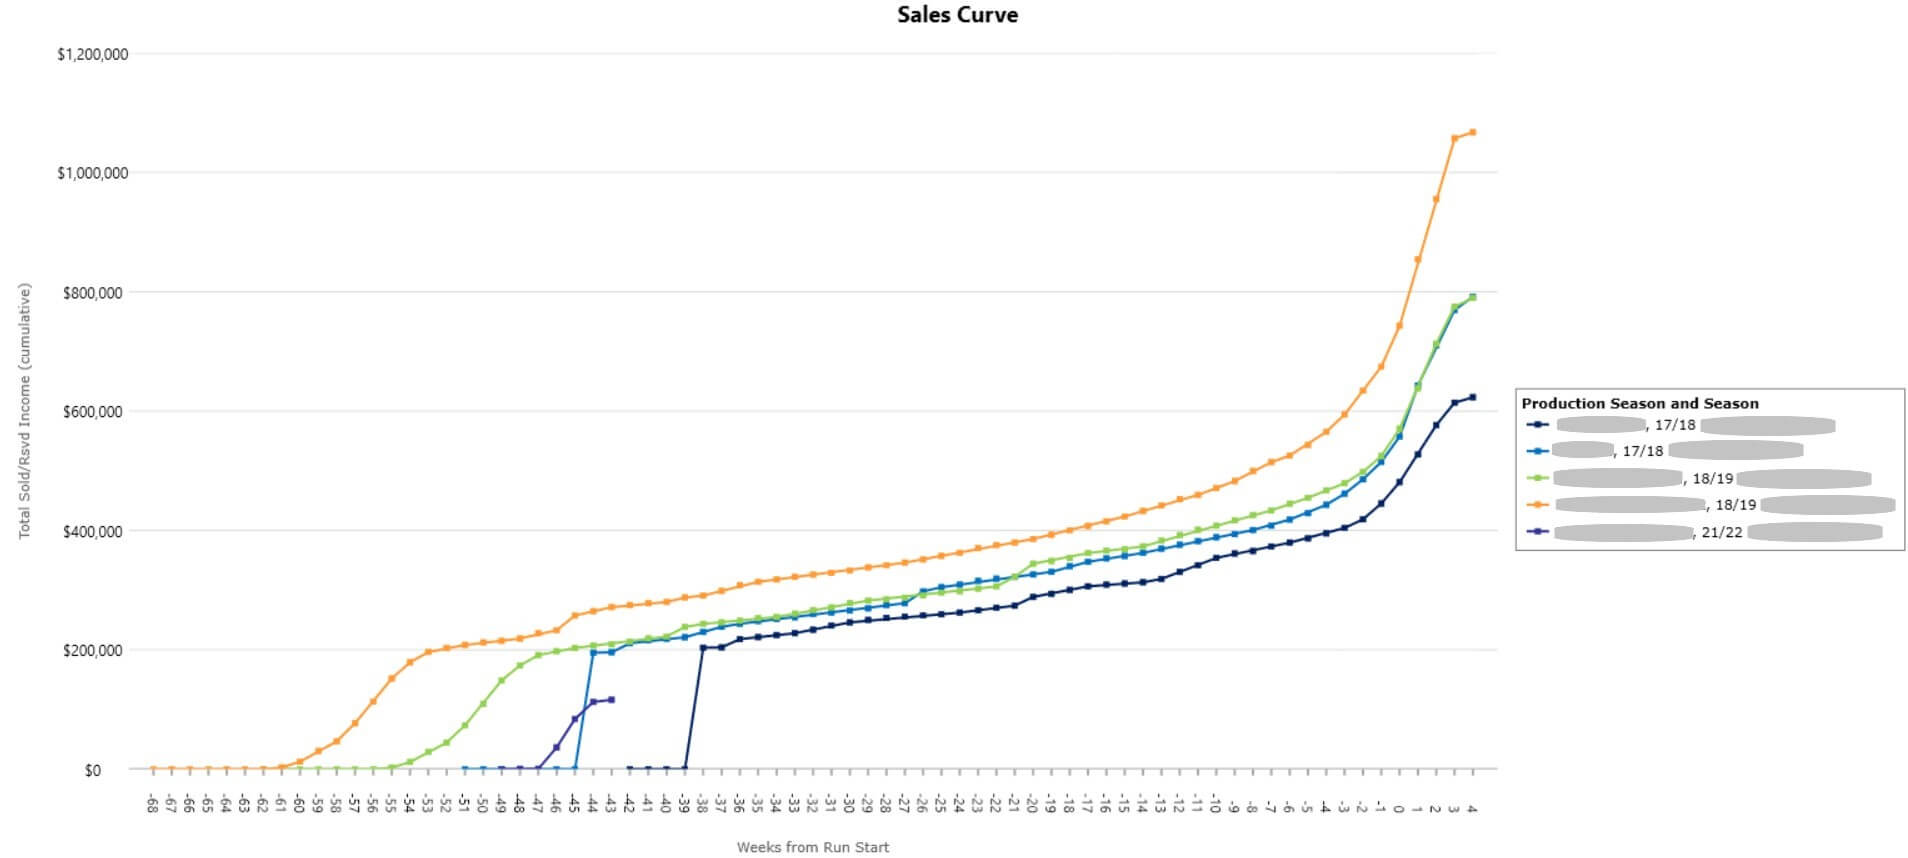
Groupings: Group on the y-axis by Production Season (or Production or Title), and Season
Why: As with the last scenario, the first grouping should help you see an easily readable version of your production title. Then, grouping by Season will help not only point out the timing of past performances, but if you’ve done the same title more than once, a Season grouping will help make sure that you’re not accidentally combining them.
Result: (picture) The result of this sales curve will be a visual for how your whole production is tracking compared to past productions. This will be especially important this season, as we don’t know how sales timing will change after the pandemic!
The Sales Curve is one of the most commonly used reports in the RMA, and for good reason! It allows you to track the speed of sales in a variety of scenarios, without the hassle of manipulating spreadsheets. If you need some help preparing your reports for the upcoming season, please reach out and we’ll be happy to help!