
RMA Feature Focus | New Year’s Resolution: Spend Less Time in Excel with These 3 RMA Reports!

Andrew Moreau
Manager, Data Ecosystem Consulting
Here is an idea for a New Year’s resolution—spend less time entering data into Excel! This blog covers three RMA reports that will help you with reporting efficiency. These reports can be run very quickly, and I hope you find them to be helpful tools to free up time for other things!
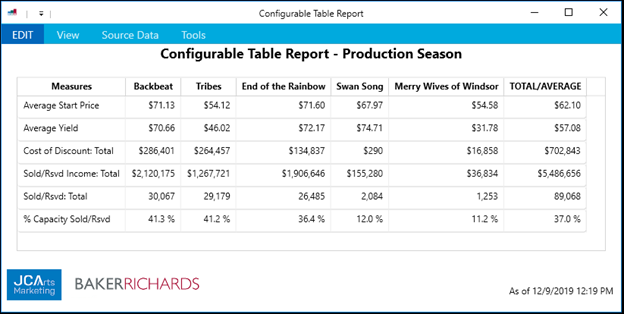
1. Configurable Table Report:
This report is a great way to pull metrics into a spreadsheet view to report on individual performances, production runs, or entire seasons. There are about 90 helpful data points which you can include in your table, including standard measures such as % capacity sold, income, and ticket sales that you can choose from. We recommend these measures as a starting point:
- % Capacity Sold/Rsvd
- Sales Chart with Dynamic Pricing
- Income
- Tessitura Budget
- Cost of Discount
- Price Band Chart
- Average Yield
- Average Price
- Average Start Price
- Days Since Price Changes
- Price Type Chart
- Seats Sold
- Velocity Sales by Day
You can choose how best to arrange your columns, for example by Season, Performances, or for further analysis, by Day of Week, Time of Day, and Genre. As with all RMA reports, the Configurable Table report updates nightly based on sales, and so there is no need to manually update the table once created.
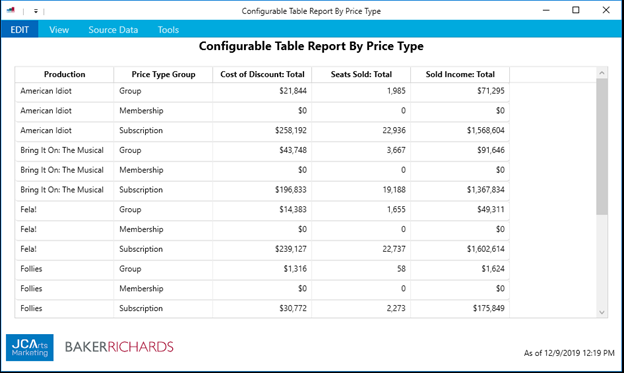
2. Configurable Table Report by Price Type:
In this version of the report, you can filter and group by Price Types as well as performances, and you also have more choice over the layout of your table, which is helpful when you are using a lot of measures or categories. Use this report when analyzing the effectiveness of single ticket or subscription campaigns, for example. You can find more information on Configurable Table reports here.
3. Weekly Wrap Report
Having worked for various organizations’ box offices in the past, I have vivid memory of manually plugging in sales numbers into Excel on a weekly basis to track how sales campaigns are performing. With the Weekly Wrap report, you can view sales per week over the past six weeks, and how close you are to reaching your targets and budget. This report allows you to filter out single or subscription sales so as only to focus on a particular campaign.
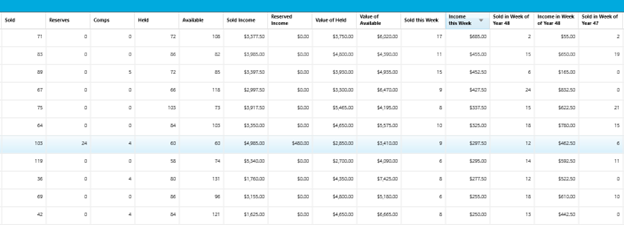
Sorting by columns in this report allows you sort performances by most or least popular in sales, which is helpful to identify performances which may warrant a price increase or additional promotion. You can find more information on the Weekly Wrap report here.
Exporting RMA Tables
While the RMA allows you to save reports in folders to stay organized, you can also save these reports as Excel files if you wish to store on your internal drives! Either use normal copy/paste commands on your keyboard, or export your spreadsheet as an Excel with the Tools menu.
I wish everyone a wonderful Holiday Season, and I hope these three reports will help with your efficiency in the New Year!
We’re Here to Help
These three reports are helpful additions to aide your ongoing pricing and inventory meetings, and establishing a routine in using them can be an efficient method to keep everyone on track and make data-driven decisions. JCA Arts Marketing supports many organizations with routine check-in meetings to do just that, and we would love to learn more about your current processes around sales and inventory monitoring. Please contact us if you are interested in learning more about how we can assist with effective monitoring and strategy.