
RMA Feature Focus: Sales Trends and Buyer Behavior Across Seasons

Andrew Moreau
Manager, Data Ecosystem Consulting
Earlier this year, JCA Arts Marketing released an audience behavior study on Reopening Sales Trends, comparing sales data from the Fall of 2021 to pre-pandemic fall seasons.
Since this study was released, we have conducted more focused analyses on individual organizations and how their fall and winter seasons have compared to the past. Now that we are just past the two-year mark of March of 2020 when the Pandemic unfolded, and there are more performances that have been through their full sales cycle in the spring season, we have the opportunity to take another look at how audience behavior is changing.
In this article, we will walk you through some RMA reports that help you measure change in audience behavior. We hope this is a helpful guideline of how to find and compare key metrics between this season and past ‘normal’ seasons. You may find that your audience’s buying behavior continues to change, so these measures will be important to continue tracking as we forecast and plan for the FY23 season.
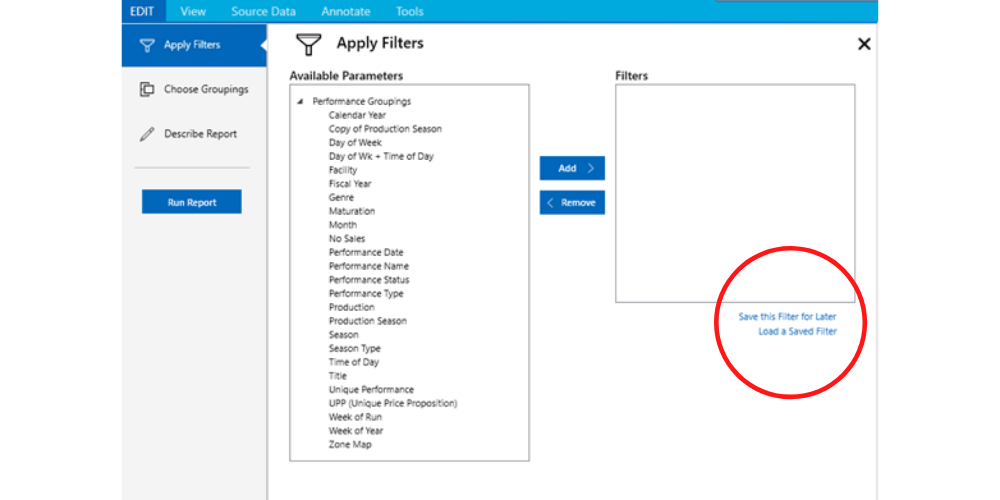
Let’s Begin! Set your report filters and save:
Be consistent with the performances that you are comparing across seasons. When creating your first report, save your filter for use in all of the reports in your analysis:
The RMA allows you to manually group performances together beyond standard criteria that can be used in both report filters and groupings. Read this recent blog by JCA Arts Marketing’s Senior Consultant and Analyst Jennifer Sowinski as she goes over this functionality in detail.
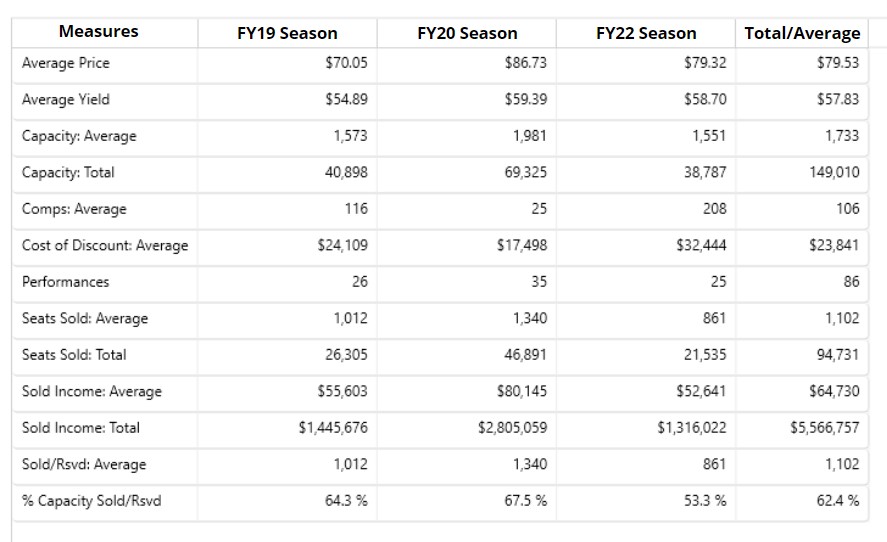
Configurable Table Report
Reasons to use this report:
- See season KPI’s at a glance.
- Output the report to an Excel Table.
Recommended report settings to get you started:
- Group columns by Season.
- Measures to include:
- Average Price – The average price offered per performance
- Average Yield – The average income per sold ticket per performance
- Comps: Average – The average number of comps issued per performance
- Cost of Discount: Average – Difference between price and yield per performance
- Seats Sold: Average – The average number of seats sold per performance
- Sold Income: Average – The average income per performance
- %Capacity Sold/Rsvd – Percentage of the house sold against total capacity
- Capacity: Total
- Performances – Displays a count of performances
- Seats sold: Total – Total number of seats sold
- Sold Income: Total – Total income
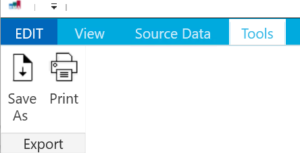
Pro tip: You can save this table as an Excel file by going to the Tools menu and clicking ‘Save As’
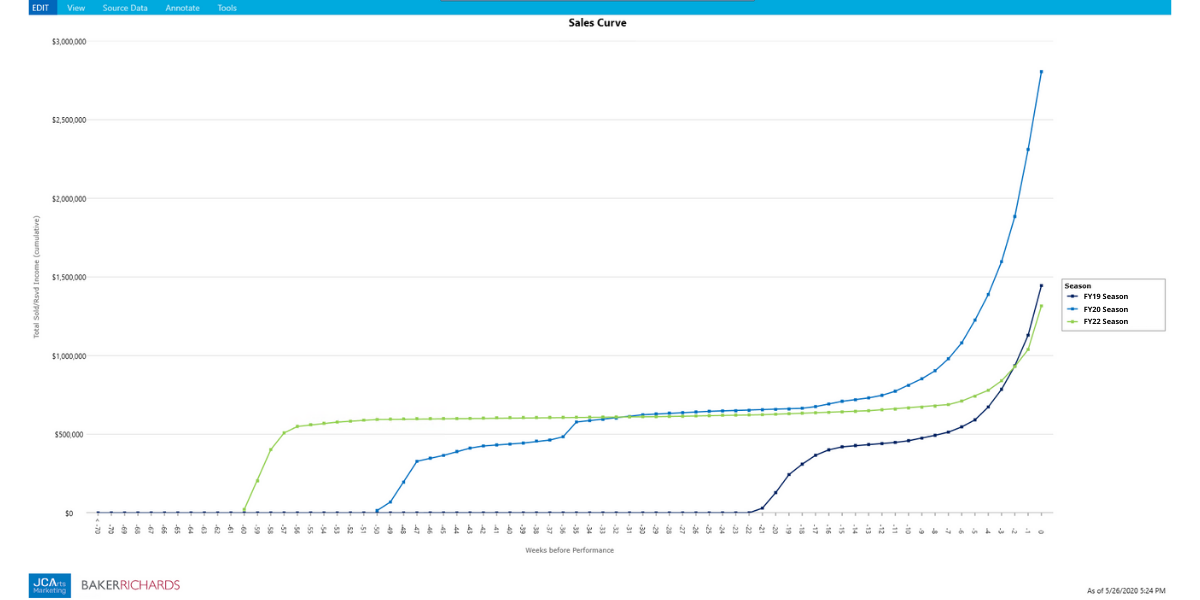
Sales Curve
Reasons to use this report:
- Who doesn’t love a sales curve?
- Visualize season sales cycles compared to one another by revenue or units.
- Measure whether your sales are trending earlier or later than previous seasons.
- Choose from flexible timeline anchors including weeks before performance, on-sale date, and start-of-run.
Recommended report settings to get you started:
- Anchor the sales curve by Weeks Before Performance.
- Use the Average Sold/Rsvp measure, particularly when comparing seasons with different numbers of performances.
- Group the Y Axis by Season.
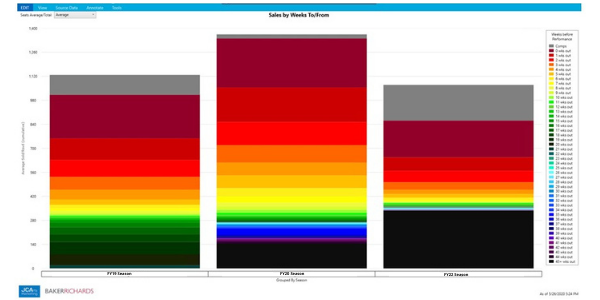
Sales by Weeks to/from Report
Reasons to use this report:
- Discover trends based on weekly sales for a set of performances.
- Choose from flexible timeline anchors including weeks before performance, on-sale date, and start-of-run.
Recommended report settings to get you started:
- Anchor the sales curve by Weeks Before Performance.
- Group the Level 1 Grouping by Season.
Interpreting the report:
The resulting report will show units sold by week leading up to the performances. The darker, bluer bands at the bottom are early sales, and the orange/ red bands up top show what was sold in the weeks closer to the start of the performance. Comps are also displayed in this report at the top in a gray box, regardless of when they were booked. For purpose of comparison, we recommend reporting on the average per performance, however you can toggle between average and total sales in the dropdown at top left of the report.
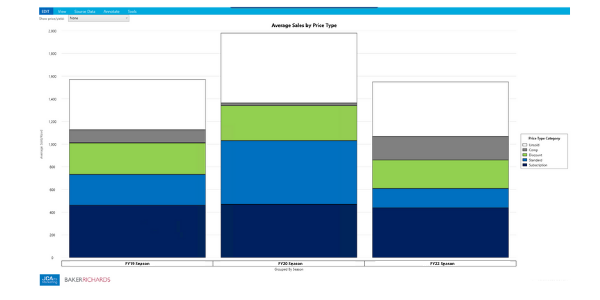
Average Sales by Price Type
Reasons to use this report:
- Compare how different price types sold across seasons.
- Drill down into Price Type Categories, Price Type Groupings, or Individual Price Types.
Recommended report settings to get you started:
- Group the Level 1 Grouping by Season.
- Group the Series (Y Axis) by Price Type Category.
Interpreting the report:
The report will show you a bar column per season, with different colored bands representing the different price categories. Always at the top, Comps appear in gray and the white space represents the average unsold inventory per performance. It is important to remember that this is an average per performance, and this report is best used when comparing performances with similar offerings. For example, if you are comparing one theater run from the past that had extended performances to a current run this season that was not extended, your average subscription tickets per performance would likely be lower in the previous season since extended runs typically consist of single ticket sales.
Every Analysis is Unique
Each organization is different and will need to tailor their analysis accordingly, and the RMA is designed for you to really drill down to the metrics that are most important to you. As you run through this set of reports, you may decide to continue to refine your comparison filters based on your findings. We’d love to learn about what you find as you compare your current season to past ones, and if your sales trends are in line with JCA’s Reopening Sales Trends Study. Moving forward, regardless of the status of the pandemic, we hope you find the above reporting tools useful in comparing season sales.
We’re also here to help! Please contact us if you are interested in learning more about how we can tailor a custom analysis for you.